
GLOBE celebrated its 18th birthday on Earth Day, 22 April 2013. This means that, in some cases, you can look at nearly 18 years of data collected through the years by GLOBE students. One school, Zakladni Skola – Ekolog. Praktikum in Jicin, Czech Republic, has been collecting data since 1995. While the typical climate study requires at least 30 years of data, it is possible to examine short-term changes in a local environment and compare that to a longer period.
The following image is a look at each December’s monthly average temperature, beginning in 1995. The black line represents the temperature trend over the seventeen years that this school has collected data – an estimated increase of .1601°C over the 17 year period.
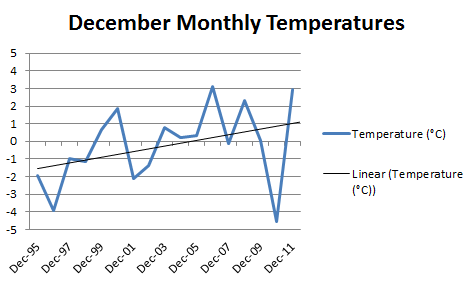
A timeseries showing December monthly temperatures from 1995-2011 for Zakladni Skola – Ekolog. Praktikum in Jicin, Czech Republic;
All data is GLOBE student collected data.
Using this knowledge, and setting the base 10 year reference period of 1998-2007, it is easy to calculate the short-term average for this station to determine the departure from that average. The average temperature for December is 0.211°C. This average is easy to calculate. First, you calculate the average daily temperature by averaging the observed maximum and minimum temperatures. Then, you average the daily average temperatures together to obtain the average temperature for the month of December. Once you’ve done that for each of the Decembers from 1998-2007, you can average those together to get your average December temperature. From here you can examine how each December departs from that average, and put it into graphical format, like below.
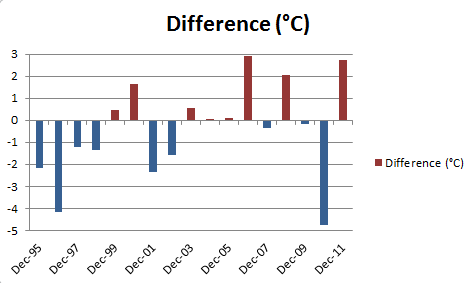
Departure from 10 year (1998-2007) average December temperature for Zakladni Skola – Ekolog. Praktikum in Jicin, Czech Republic; All data is GLOBE student collected data
Notice that at the beginning of the time period the occurrence of below normal temperatures was more common. As time progressed, temperatures became more above normal, which supports the trend in monthly temperature. Globally, the month of December 2011 was the 322nd consecutive month where global average temperature was above the 20th century normal – the last month that was below normal across the globe was February 1985.
Another school, Primarschule Neufeld in Thun, Bern Switzerland, has been collecting atmosphere data since 1998. The graph below shows the monthly average temperature for each December since 1998, which indicates a positive temperature trend of 0.088°C over the entire time period.
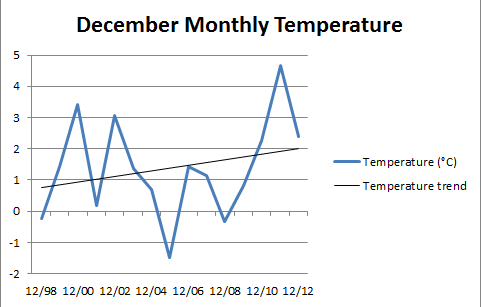
A timeseries showing December monthly temperatures from 1998-2012 for Primarschule Neufeld in Thun, Bern Switzerland;
All data is GLOBE student collected data
Using the same base 10 year reference period of 1998-2007 as we did for the school from the Czech Republic, it is found that the average temperature for December for the school in Switzerland is 1.101°C.
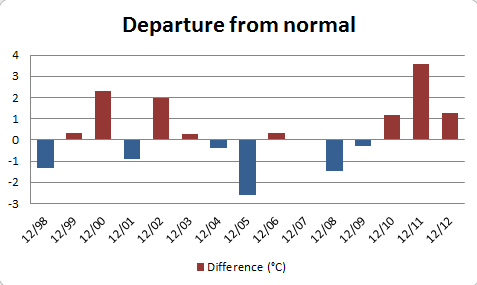
Departure from the 10 year (1998-2007) average December temperature for Primarschule Neufeld in Thun, Bern Switzerland; All data is GLOBE student collected data.
It is very important, as a member of the GLOBE community, to continue building this observational record for your site. Every data point is important in describing the bigger picture.
Suggested activity: Over the next 12 years, GLOBE students will collect enough data to be able to examine long-term changes in variables such as air temperature. However, you can start examining your data, or data of a nearby school now. You can even examine the data from these two schools to look at the trends for June. What do you think you will find? We’d love to hear from you. Leave us a comment, send us an email or get in touch on our Facebook Page.
Very interesting to know!!!!
Thank you very much