Air Quality Bundle - Earth as a System
Air Quality Bundle
Air quality is a measure of how clean or polluted the air is. Pollutants are classified into two categories: Primary and Secondary.
- Primary pollutants are emitted directly from a source and include industrial plant emissions, the combustion of oil and gas, smoke from fires, gases and ash from volcanic eruptions, blowing dust, and hydrocarbon emissions by some trees.
- Secondary pollutants are caused by chemical reactions in the atmosphere between different primary pollutants. This classification includes substances like ozone and acid rain.
Learn more about MyNASA Data and the Air Quality protocol bundle.
Air Quality & Human Health
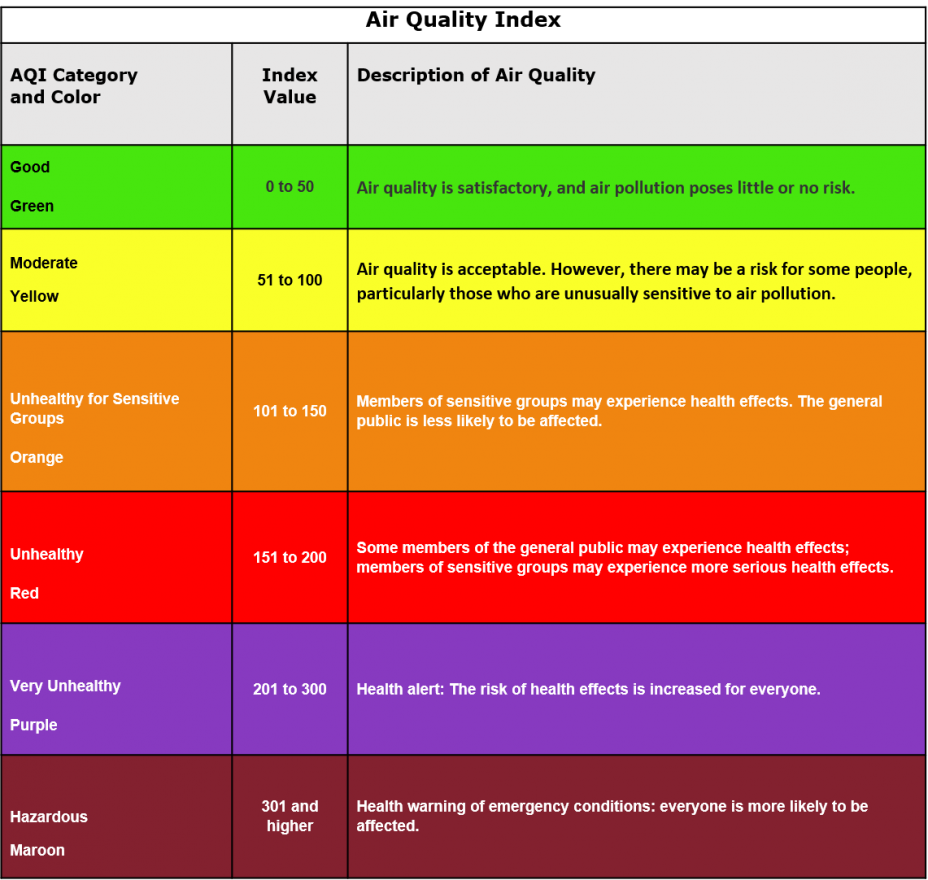
Because of their impacts on human health, primary and secondary pollutants are closely monitored by environmental agencies around the world. After assessing the overall pollution in their local area, these organizations produce an Air Quality Index (AQI) value, a unitless number that communicates the health risk caused by the amount of pollution in the air. AQIs range from 0 to 500 and can be based on exclusively particulate matter levels, exclusively ozone levels, or a combination of the two. To learn more about how air quality is measured, check out NOAA's air quality page
Check out the chart below to learn more about the Air Quality Index:
The major air pollutants monitored by environmental agencies include:
- Ground-level Ozone (O₃): A secondary pollutant that forms when nitrogen oxides and volatile organic compounds (VOCs) react in sunlight. VOCs are emitted from places like factories, power plants, vehicles, and trees.
- Carbon Monoxide (CO): A primary pollutant caused by the combustion of fossil fuels.
- Sulfur Dioxide (SO₂): A primary pollutant emitted from power plants, factories, and volcanos.
- Nitrogen Dioxide (NO₂): A primary pollutant caused by the combustion of fossil fuels.
- Particulate matter (PM)/Aerosols: A mixture of solid particles and liquid droplets suspended in the air. PM exists in a range of sizes from large particles (<10 microns) like dust, pollen, and mold, to small particles (<2.5 microns) like emissions from combustion processes or organic compounds. Particulate matter can be both a primary and secondary pollutant. Check out the Environmental Protection Agency's image below for a visual representation of PM size.
By monitoring the air quality of our local environments, we can help inform our community members and guide policy decisions in our local governments. Scientists can also use the data GLOBE students collect to verify their satellite measurements, thus increasing the accuracy of their forecasts. Inside the Air Quality Bundle, you can find a collection of protocols, prompts, and projects related to these issues and their intersections with various Earth Spheres.
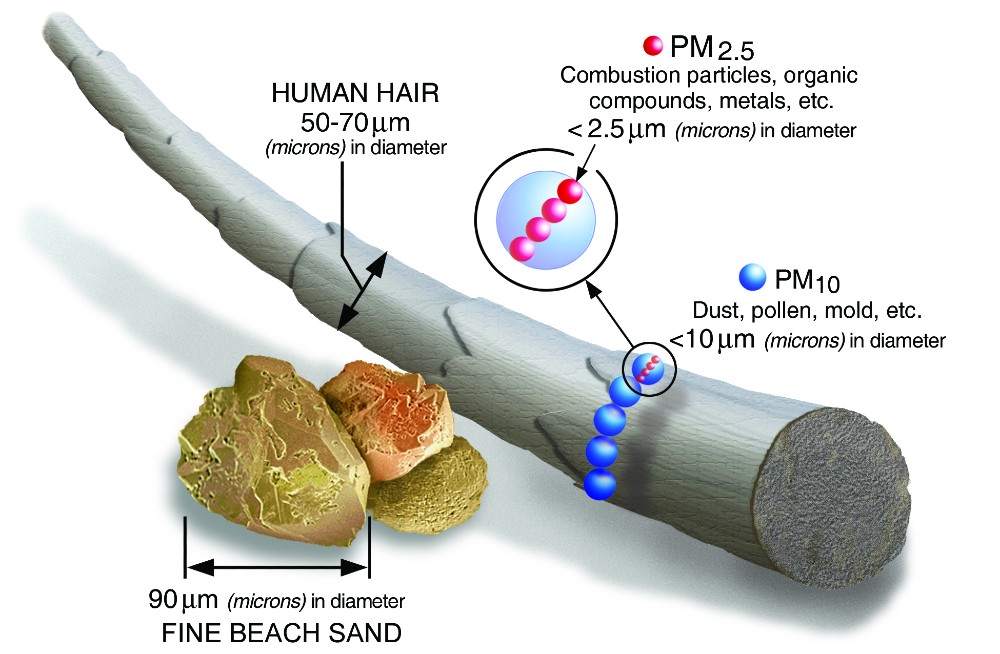
Size comparisons of different particulate matter
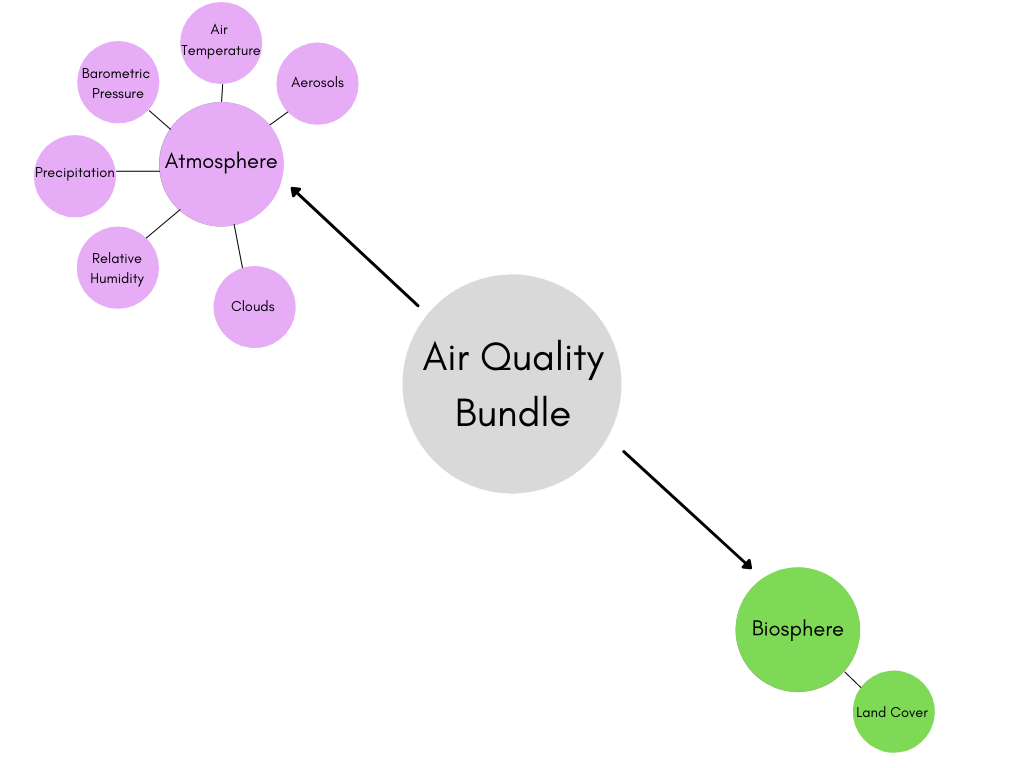
Bundle Overview
- Atmosphere
- Aerosol
- Aerosols scatter sunlight traveling through Earth’s atmosphere and make the air appear dirty or hazy. By measuring the Aerosol Optical Thickness—or how much sunlight is affected by these aerosols—at different wavelengths, we can determine information about the size and type of particulate matter in the atmosphere.
- Air Temperature
- Higher temperatures can increase the amount of secondary pollutants in the atmosphere, so the relationship between temperature and air quality is an important investigation topic. By measuring the current as well as the daily maximum and minimum temperatures, we can learn more about how secondary pollutants form in the sky.
- Barometric Pressure
- The barometric pressure influences how much air moves around, so it has a significant impact on air quality in a particular area. For example, low pressure air typically reduces air pollution by causing wet or windy conditions, while high pressure air is often stagnant, leading to higher pollution.
- Clouds
- The amount of clouds in the sky affect how much incoming solar radiation is reflected back into space for a particular area. Since secondary pollutants are heavily influenced by the interaction of this radiation with primary pollutants, cloud cover can have a significant impact on air quality and the formation of contaminants like ozone.
- Precipitation
- As water, snow, or other forms of precipitation fall from the sky, they can combine with airborne particulate matter and transport these pollutants down to the surface. This essentially "washes out" the sky and reduces overall pollution levels. By studying how precipitation interacts with aerial particles, we can better understand how weather patterns influence overall air quality.
- Relative Humidity
- High levels of humidity can encourage aerosols to grow or stick together, making them more likely to fall to the ground or adhere to terrestrial surfaces. This removes certain pollutants from the sky and can affect local levels of air pollution.
- Aerosol
- Biosphere
- Land Cover Classification
- Natural sources of air pollution include sand, dust, and the volatile organic compounds produced by plants. By maintaining an accurate record of these potential sources of natural air pollution, we can more thoroughly explain air quality trends and identify potential pollutant point sources.
- Land Cover Classification
- Supporting Material
Air quality is affected by a number of factors like the pollutant source, the pollutant type, and local climatological and weather conditions.
Pollutant Sources
There are two primary sources of air pollutants: Natural and Anthropogenic (man-made).
Natural pollutant sources are part of Earth’s natural climatological and ecological cycles. Some occur seasonally, like wildfire smoke and dust from dust storms, while others are instigated by certain climactic conditions like drought. Vegetation can also create visible pollutants in the atmosphere. Certain plants release volatile organic compounds (VOCs) that quickly react to form aerosols and cause haze. You can see an example of this phenomenon in the "smoke" at the Great Smoky Mountains.
Other sources of natural pollution are less predictable but can have significant effects on air quality around the globe. For example, ash and sulfur dioxide from highly-explosive volcanic eruptions can be spread around the world by winds high in Earth’s atmosphere. These pollutants not only create health hazards, but also reflect incoming solar radiation which cools the environment underneath.
Anthropogenic pollutant sources are the result of human activity. The main source of anthropogenic pollution is the combustion of fossil fuels for transportation, heat and power generation, and industrial facility operation. Depending on the type of fuel being burned—coal, oil, or natural gas—and the intended purpose, different types of air pollutants can be produced. These pollutants can include fine particulate matter and various gases.
In most cases, anthropogenic air pollution is emitted from a specific location like a factory or power plant. Since the pollutant stems from a singular location, we call these sites point sources of pollution. When we study the air quality of particular region, it can very helpful to know where these point sources are located in proximity to your measurement site.
Pollutant Types
The two main types of air pollution are primary and secondary pollutants. Primary pollutants are substances that exist in the chemical composition in which they were originally omitted, while secondary pollutants are compounds formed by interactions between primary pollutants and the environment.
Most anthropogenic primary pollutants are caused by fossil fuel combustion. These pollutants include:
- Nitrogen Oxides (NOx)
- Nitric Oxide (NO)
- Nitrogen Dioxide (NO2)
- Sulfur dioxide (SO₂)
Vehicles primarily produce NOx while SO₂ is generated by smelting. Power plants that generate electricity from fossil fuel combustion can emit both NOx and SO₂ . However, all of these sources can produce additional pollutants dependent upon how effectively they combust their fuels. Organic compounds, like VOCs and particulate organic compounds (POCs), are primarily caused by incomplete combustion of their fossil fuel source.
Some of these sources also produce particulate matter (PM), a broad category of pollutant classification that can be either liquid or solid and composed of a variety of compounds in a wide range of sizes. The specific composition and size of the produced PM depends largely on the type of fuel used. For example, coal combustion PM is mostly composed of black carbon (incombustible organic matter in the coal) and oxides of silicon, aluminum, and iron.
However, other industrial processes also produce particulate matter. Mining, refining, and manufacturing products such as iron, steel, cement, asphalt, grain, and wood products produce particulate matter that can range from >15 microns to <2.5 microns in diameter.
Check out the chart below to see how PM is classified:
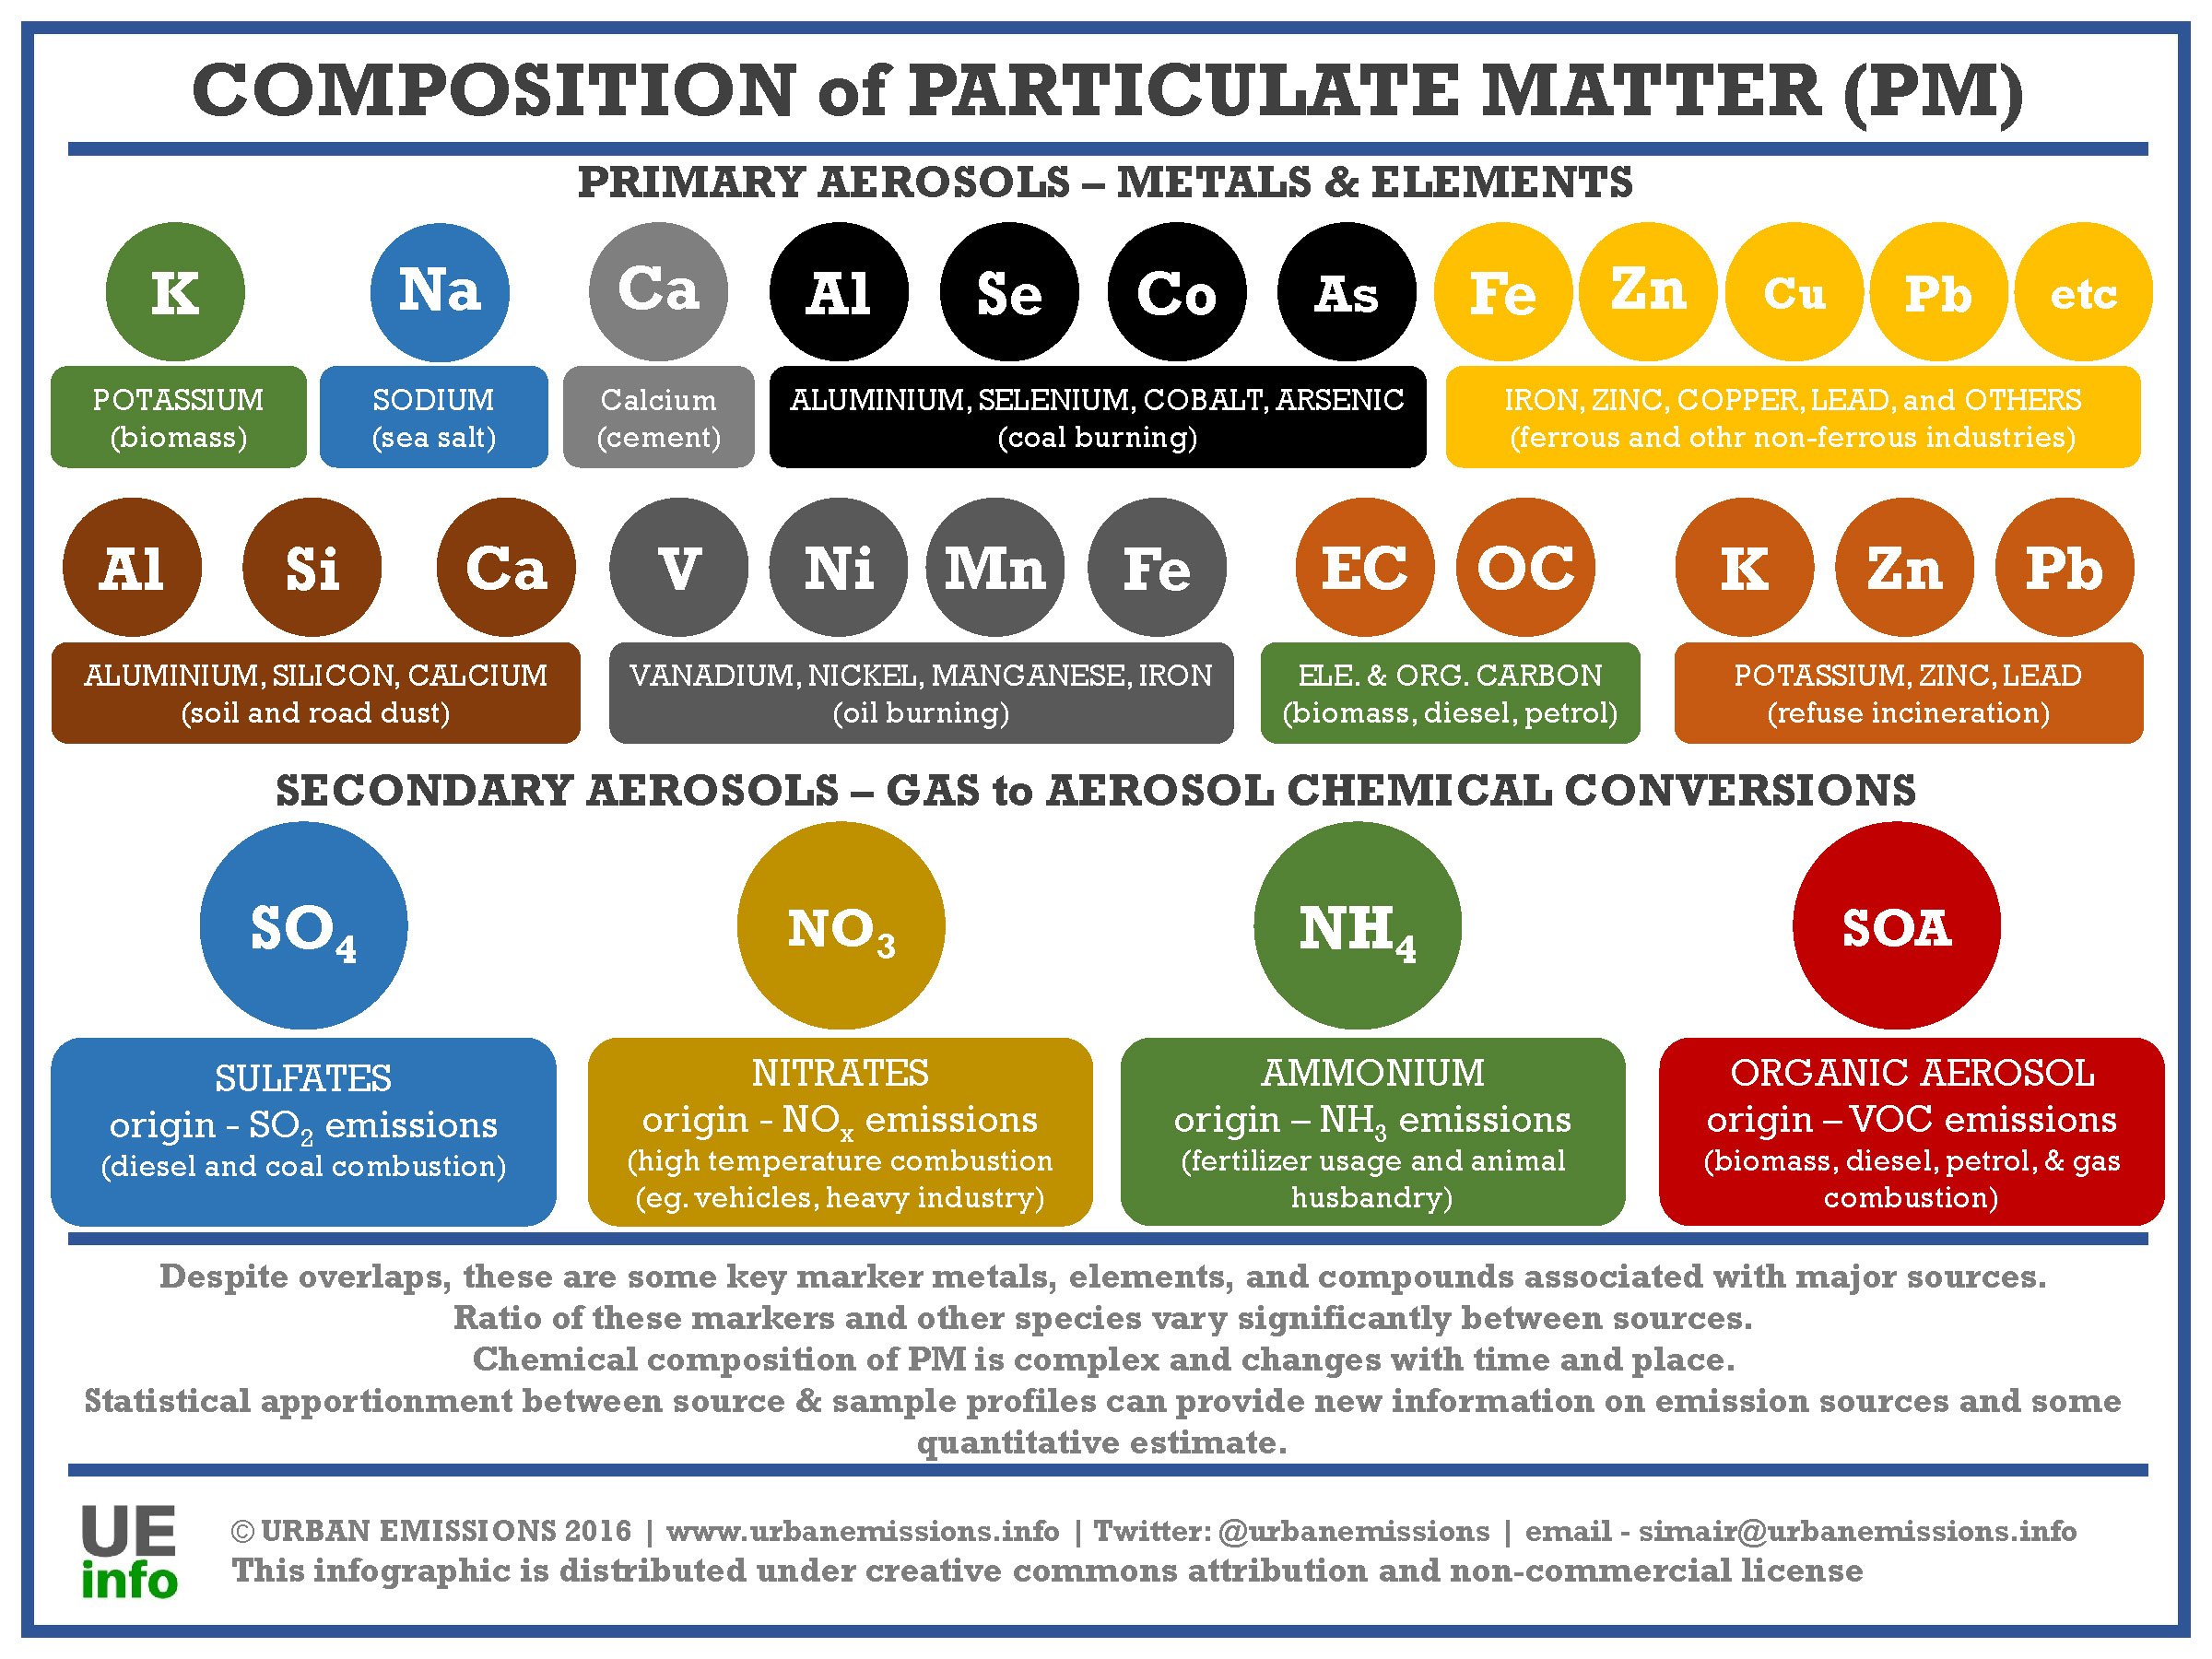
Source: UrbanEmissions.info
Anthropogenic secondary pollutants form when primary pollutants chemically interact with the environment. These pollutants include:
- Photochemical smog
- Acid Rain
- Ground-level ozone (O₃)
Ground-level ozone presents one of the greatest risks from air pollution and is formed when nitrogen oxides and volatile organic compounds react in the presence of sunlight. According to the EPA, ozone can cause the muscles in our airways to constrict, trapping air in the lung's alveoli. This constriction can make it difficult to take a deep breath and aggravate certain pre-existing medical conditions. Those at a particular risk from ozone include:
- Children
- Older adults
- Individuals with asthma or other respiratory conditions
Weather & Pollution
Weather patterns greatly influence regional air quality. For example, large wind gusts transport many pollutants from their source and precipitation generally reduces the amount of pollutants in the air. Additionally, cloud cover also plays a large role in the formation of secondary pollutants. Since these compounds need sunlight to catalyze, sunny days may have higher AQIs than cloudy ones. The formation of these substances are also accelerated by higher temperatures.
Additional Resources
Student Questions
Before taking measurements out in your local community, it's beneficial to first focus your approach by creating research questions. A few examples of these questions include:
- How does the wind's direction affect the air quality in my area?
- How is the sky's color related to Aerosol Optical Thickness?
- How do weather variables like temperature, relative humidity, and air pressure affect the air quality in my area?
- How can satellite and weather measurements be used to explain different air quality events?
Student Projects
Explore some of the student research projects inspired by the Air Quality Bundle:
- The Effects of Aerosols on Water Quality
- Anna Willard - St. Francis Xavier Catholic School
- Comparing the Observable Seasonal Trends in Aerosol Measurements in Kingsburg, CA Over 2018 – 2020
- Saneh Kahlon, Judith Reyes, Ajmeet Pama Ghuman, Jillian Sasaki - Kingsburg High School
- Relationship Between the Quantity of Particulate Matter in the Atmosphere, Weather Conditions and Groundcover Varieties
- Manassanan Rattanachoksirikul, Pattradanai Toopsuwan - Triam Udom Suksa School
- AOT is Blowing With The Wind
- Bayleigh Jetton, Rhonnie Jetton - Alpena Elementary/Middle School
- The Effects of California’s Camp Fire on Aerosol Measurements in Kingsburg, CA
- Saneh Kahlon, Ajmeet K. Pama Ghuman, Jillian Sasaki, Judith Reyes - Kingsburg High School
- Calitoo Aerosol Data Show Some Correlation to Satellite Data from MODIS and LIDAR
- Jessica Chernoff, Macary George, James Moriarty - Medford Memorial Middle School
- Does Wind Direction Affect the Amount of Aerosols?
- Brendan Janasiewicz, Daniel Baez-Perez, Travis Brand - Our Lady of Mount Carmel School
- Does car exhaust affect the AOT levels?
- Alexis Beavers, Kate Eichberg, Michael Nguyen, Calum Barnes, Theresa Catimbang - Our Lady of Mount Carmel School
To get a better idea of all the variables that comprise the air quality bundle, check out the following case study trying to answer the question:
How can satellite and weather measurements be used to explain air quality events?
The graph below shows the Aerosol Optical Thickness measured with a Calitoo sun photometer at Sunridge Middle School in Athena, Oregon. Taken from the GLOBE Visualization System, the graph's period of interest ranges from July 1 – August 31, 2018.
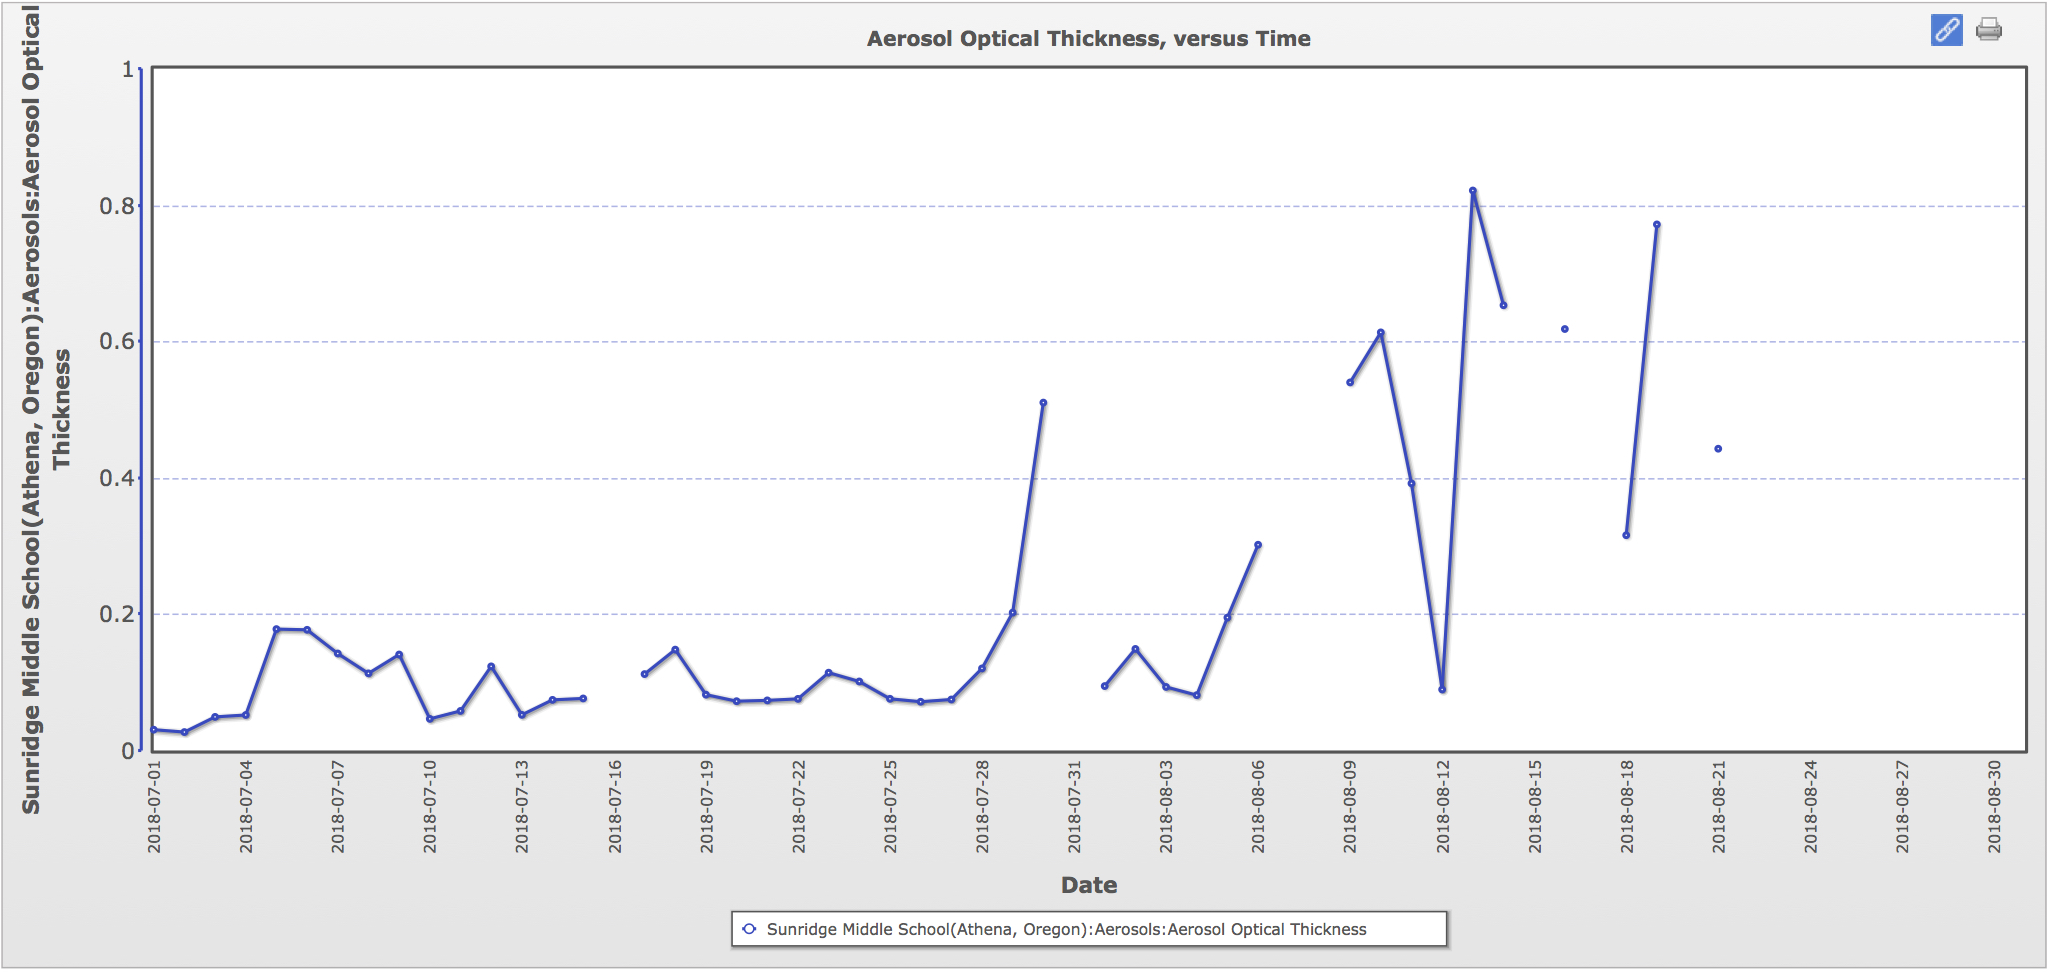
From the graph, we can observe generally low AOT (< 0.2) values during the beginning of our time interval. However, there is a sharp increase in AOT values in the middle of August, with the largest value (~0.82) measured on August 13.
Calitoo & MODIS AOT Measurements - GLOBE Visualization System
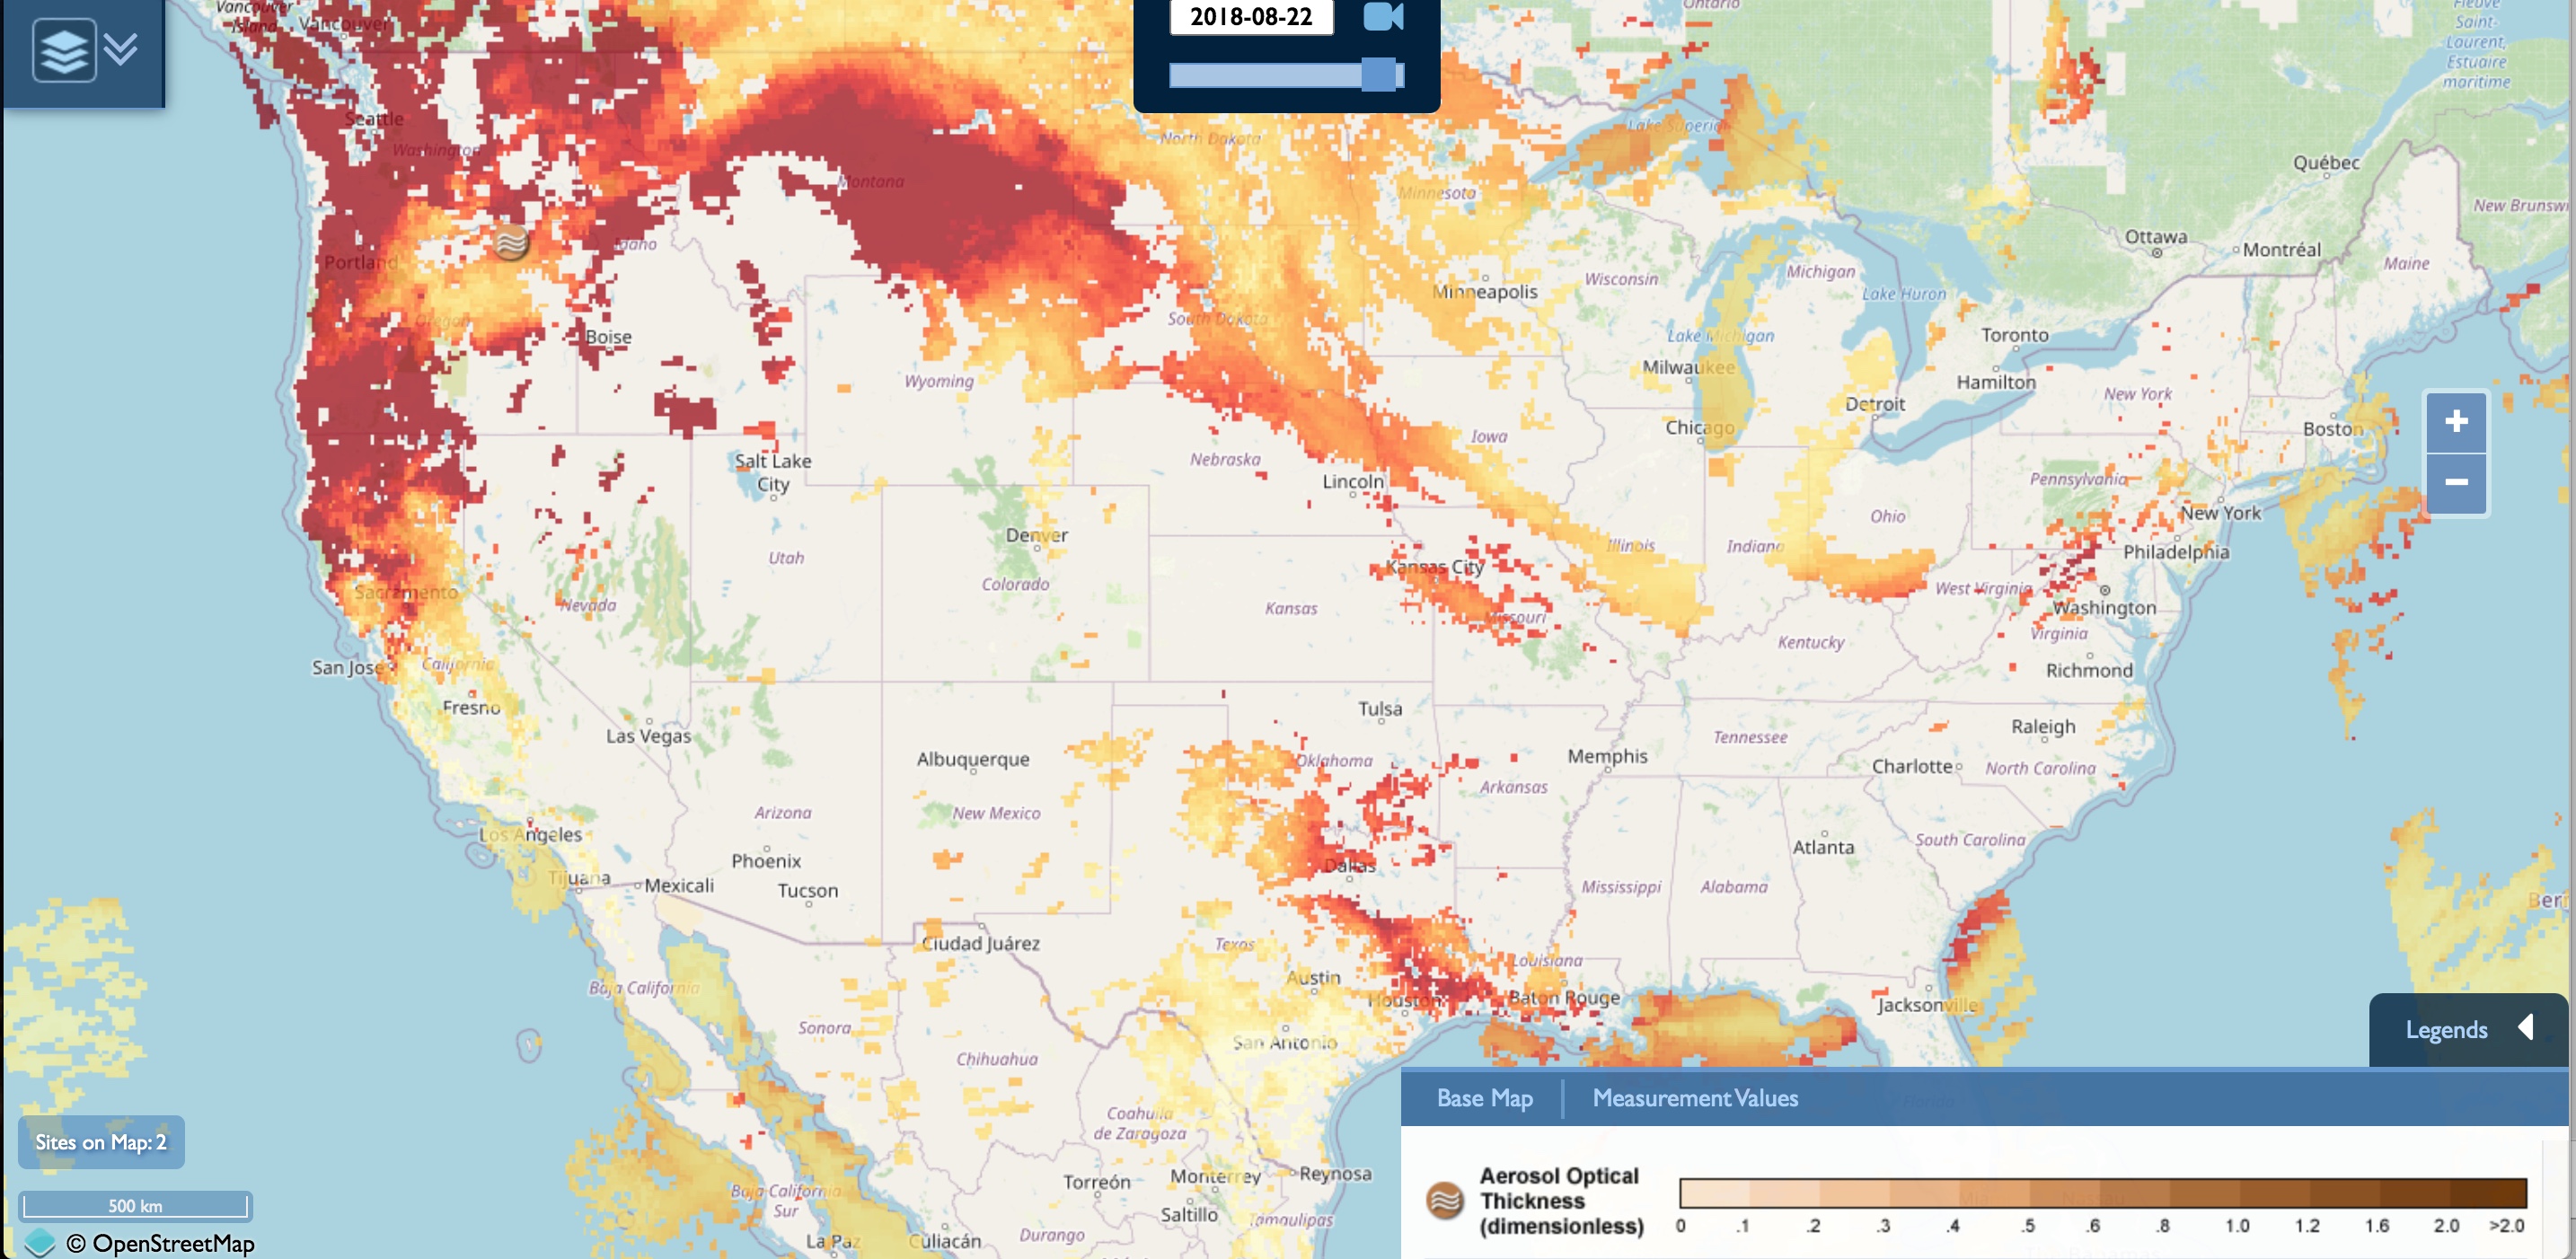
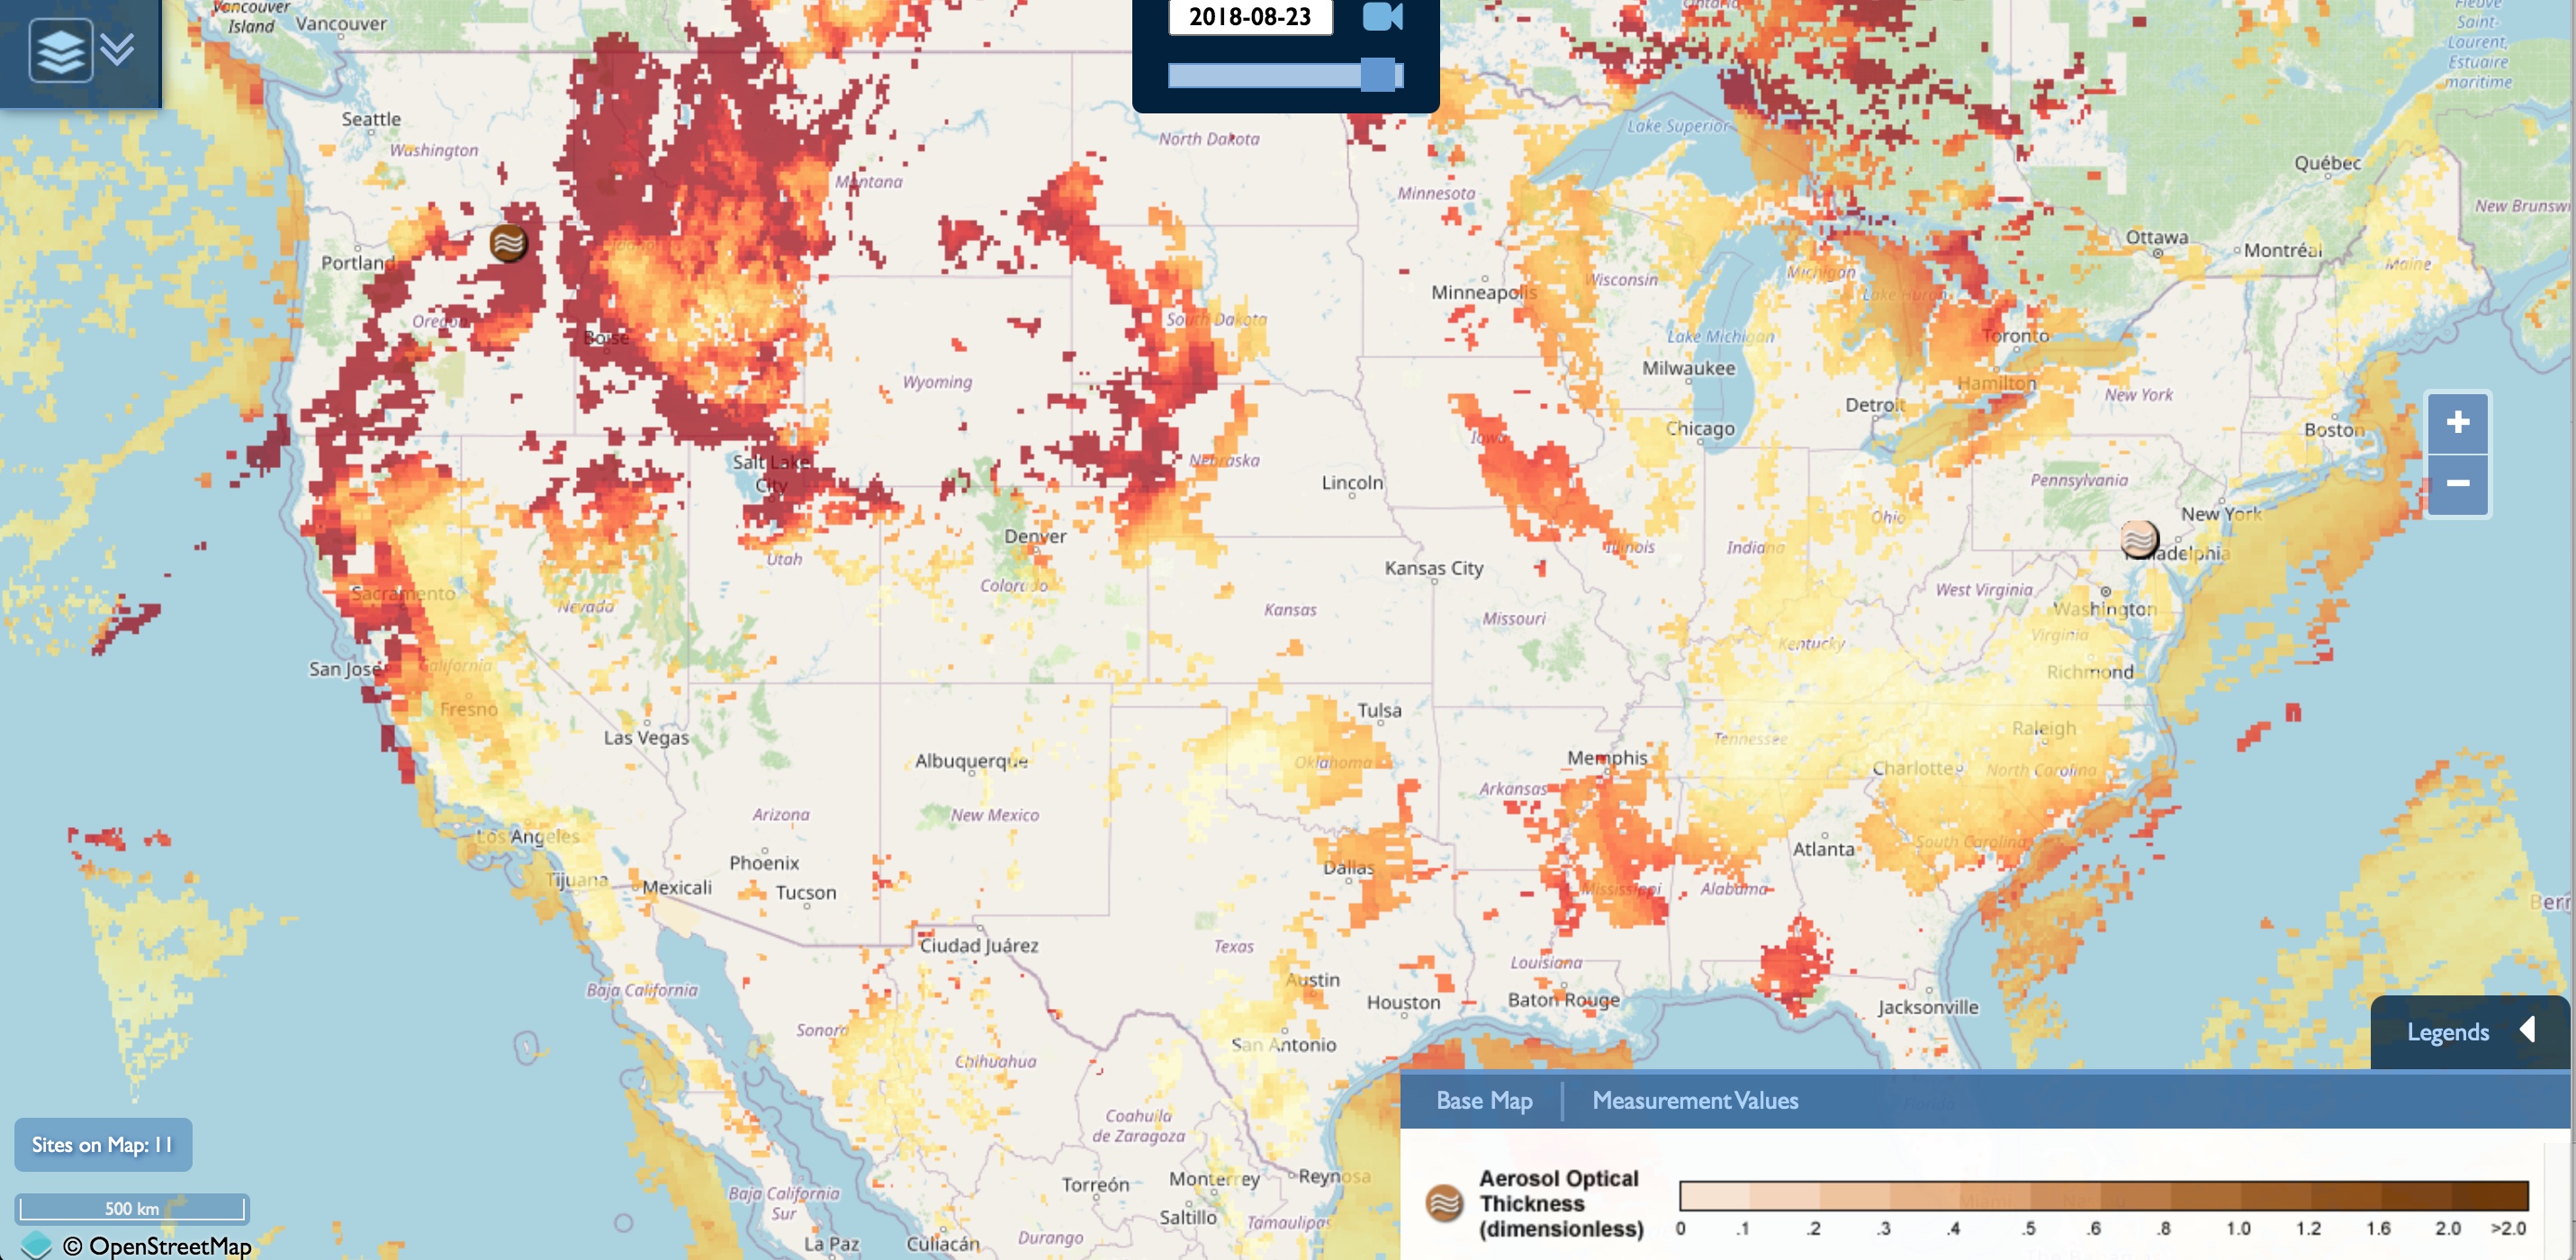
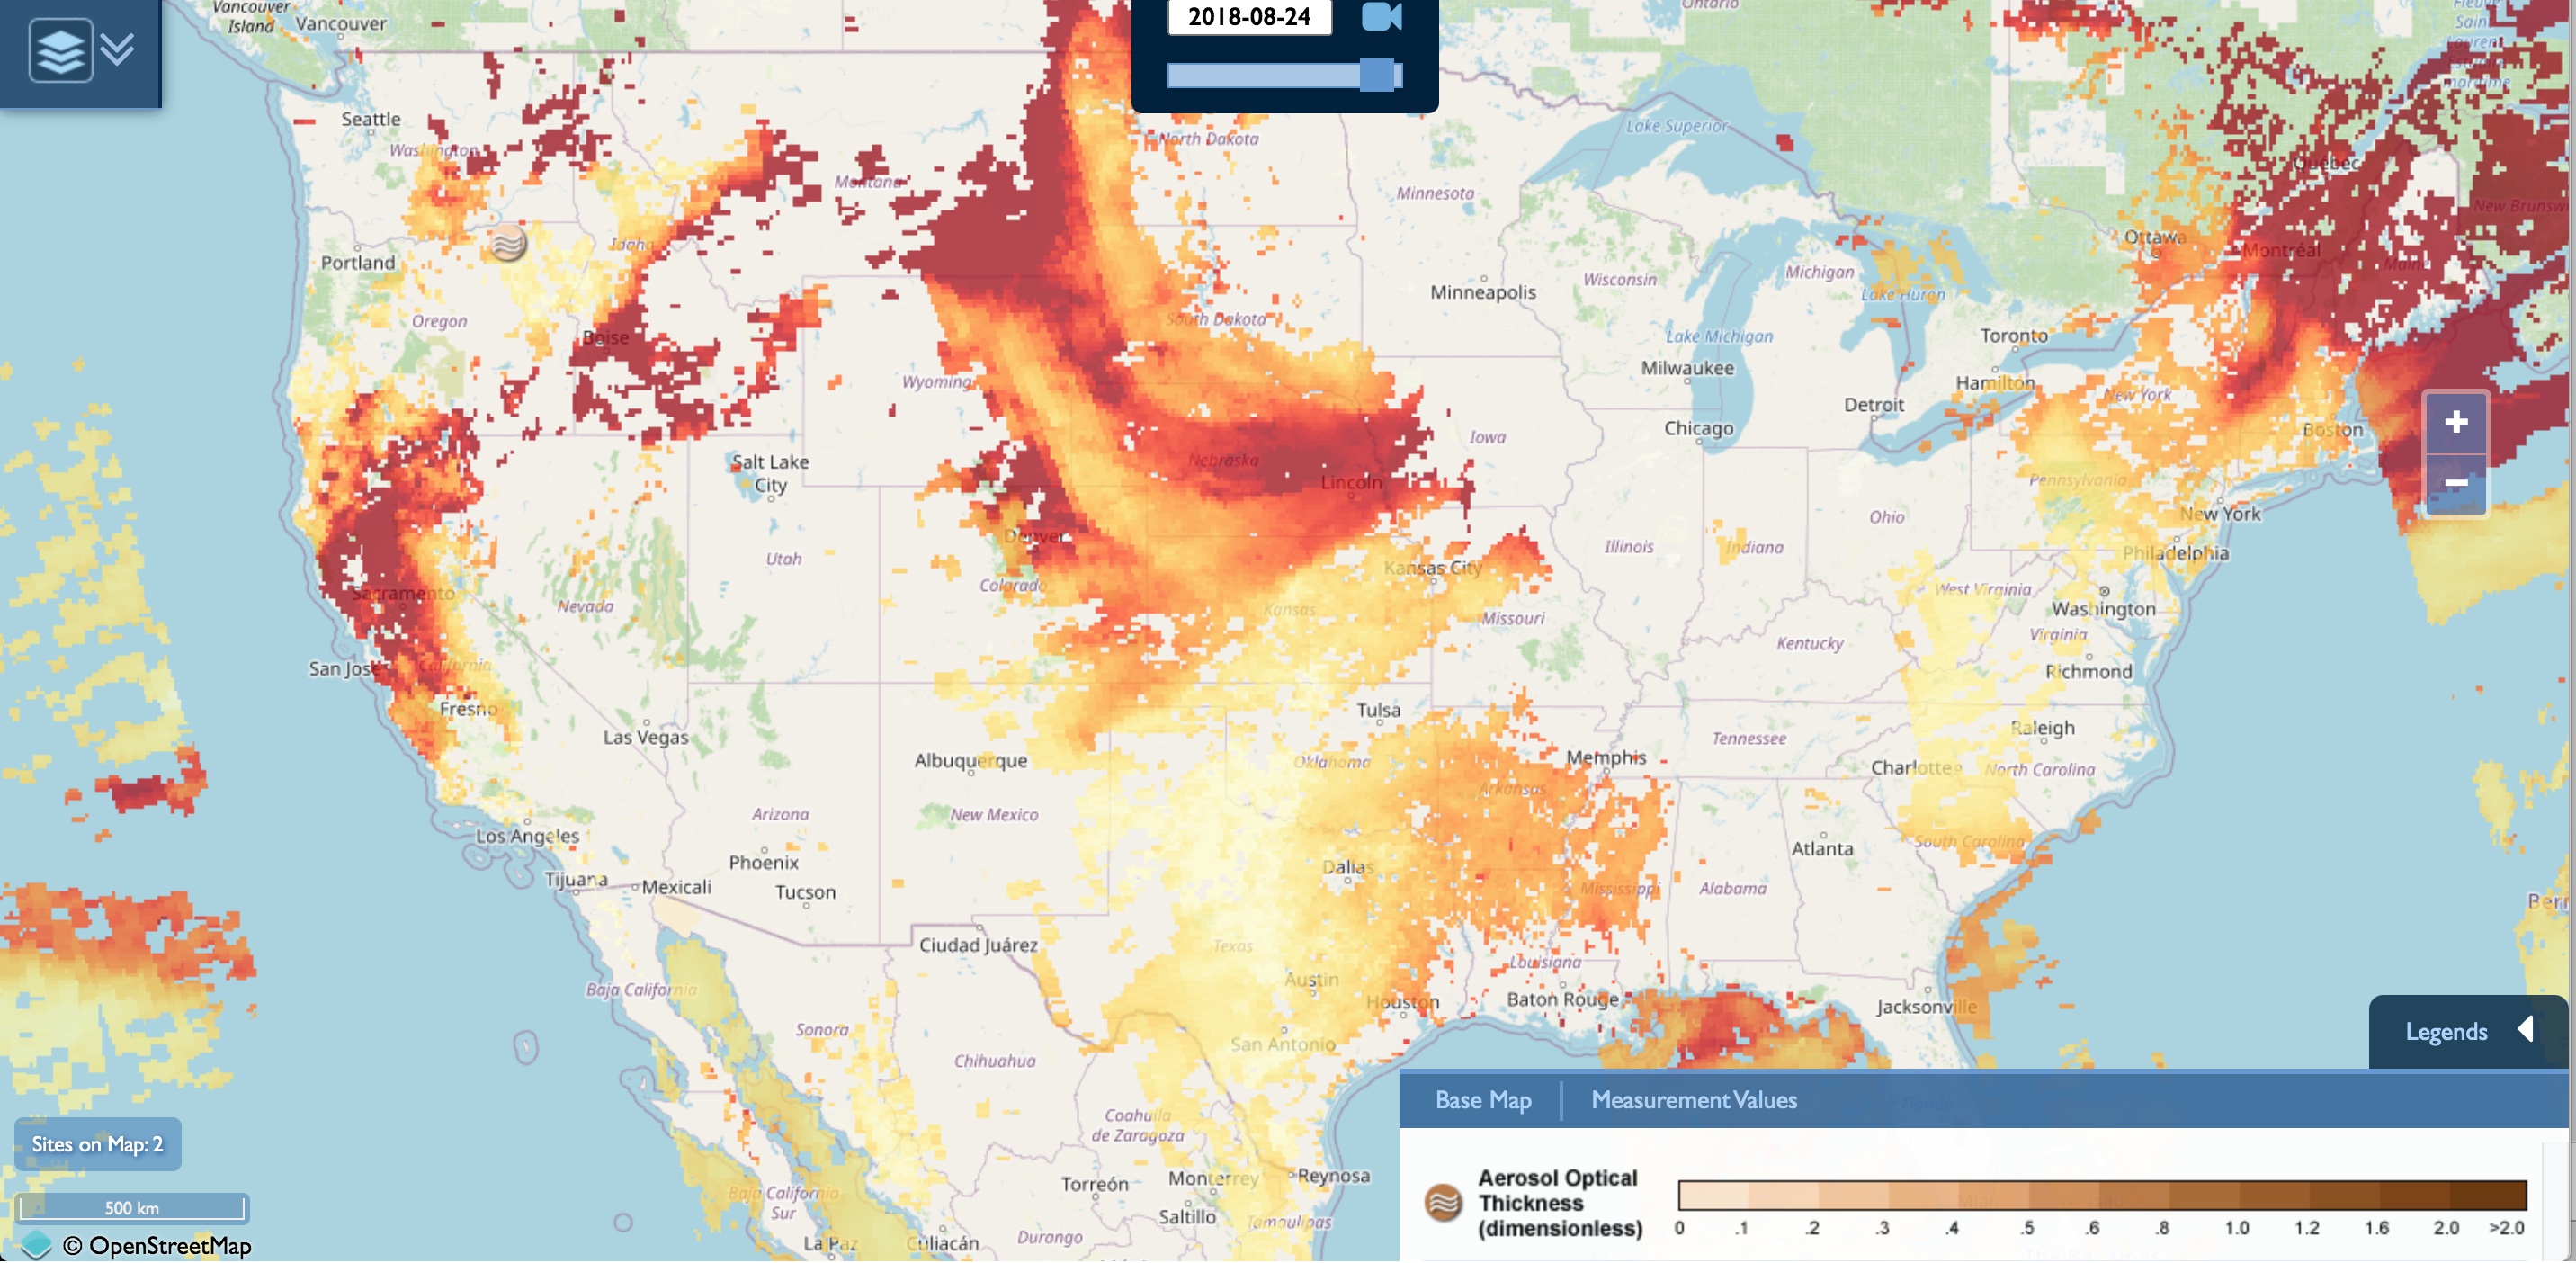
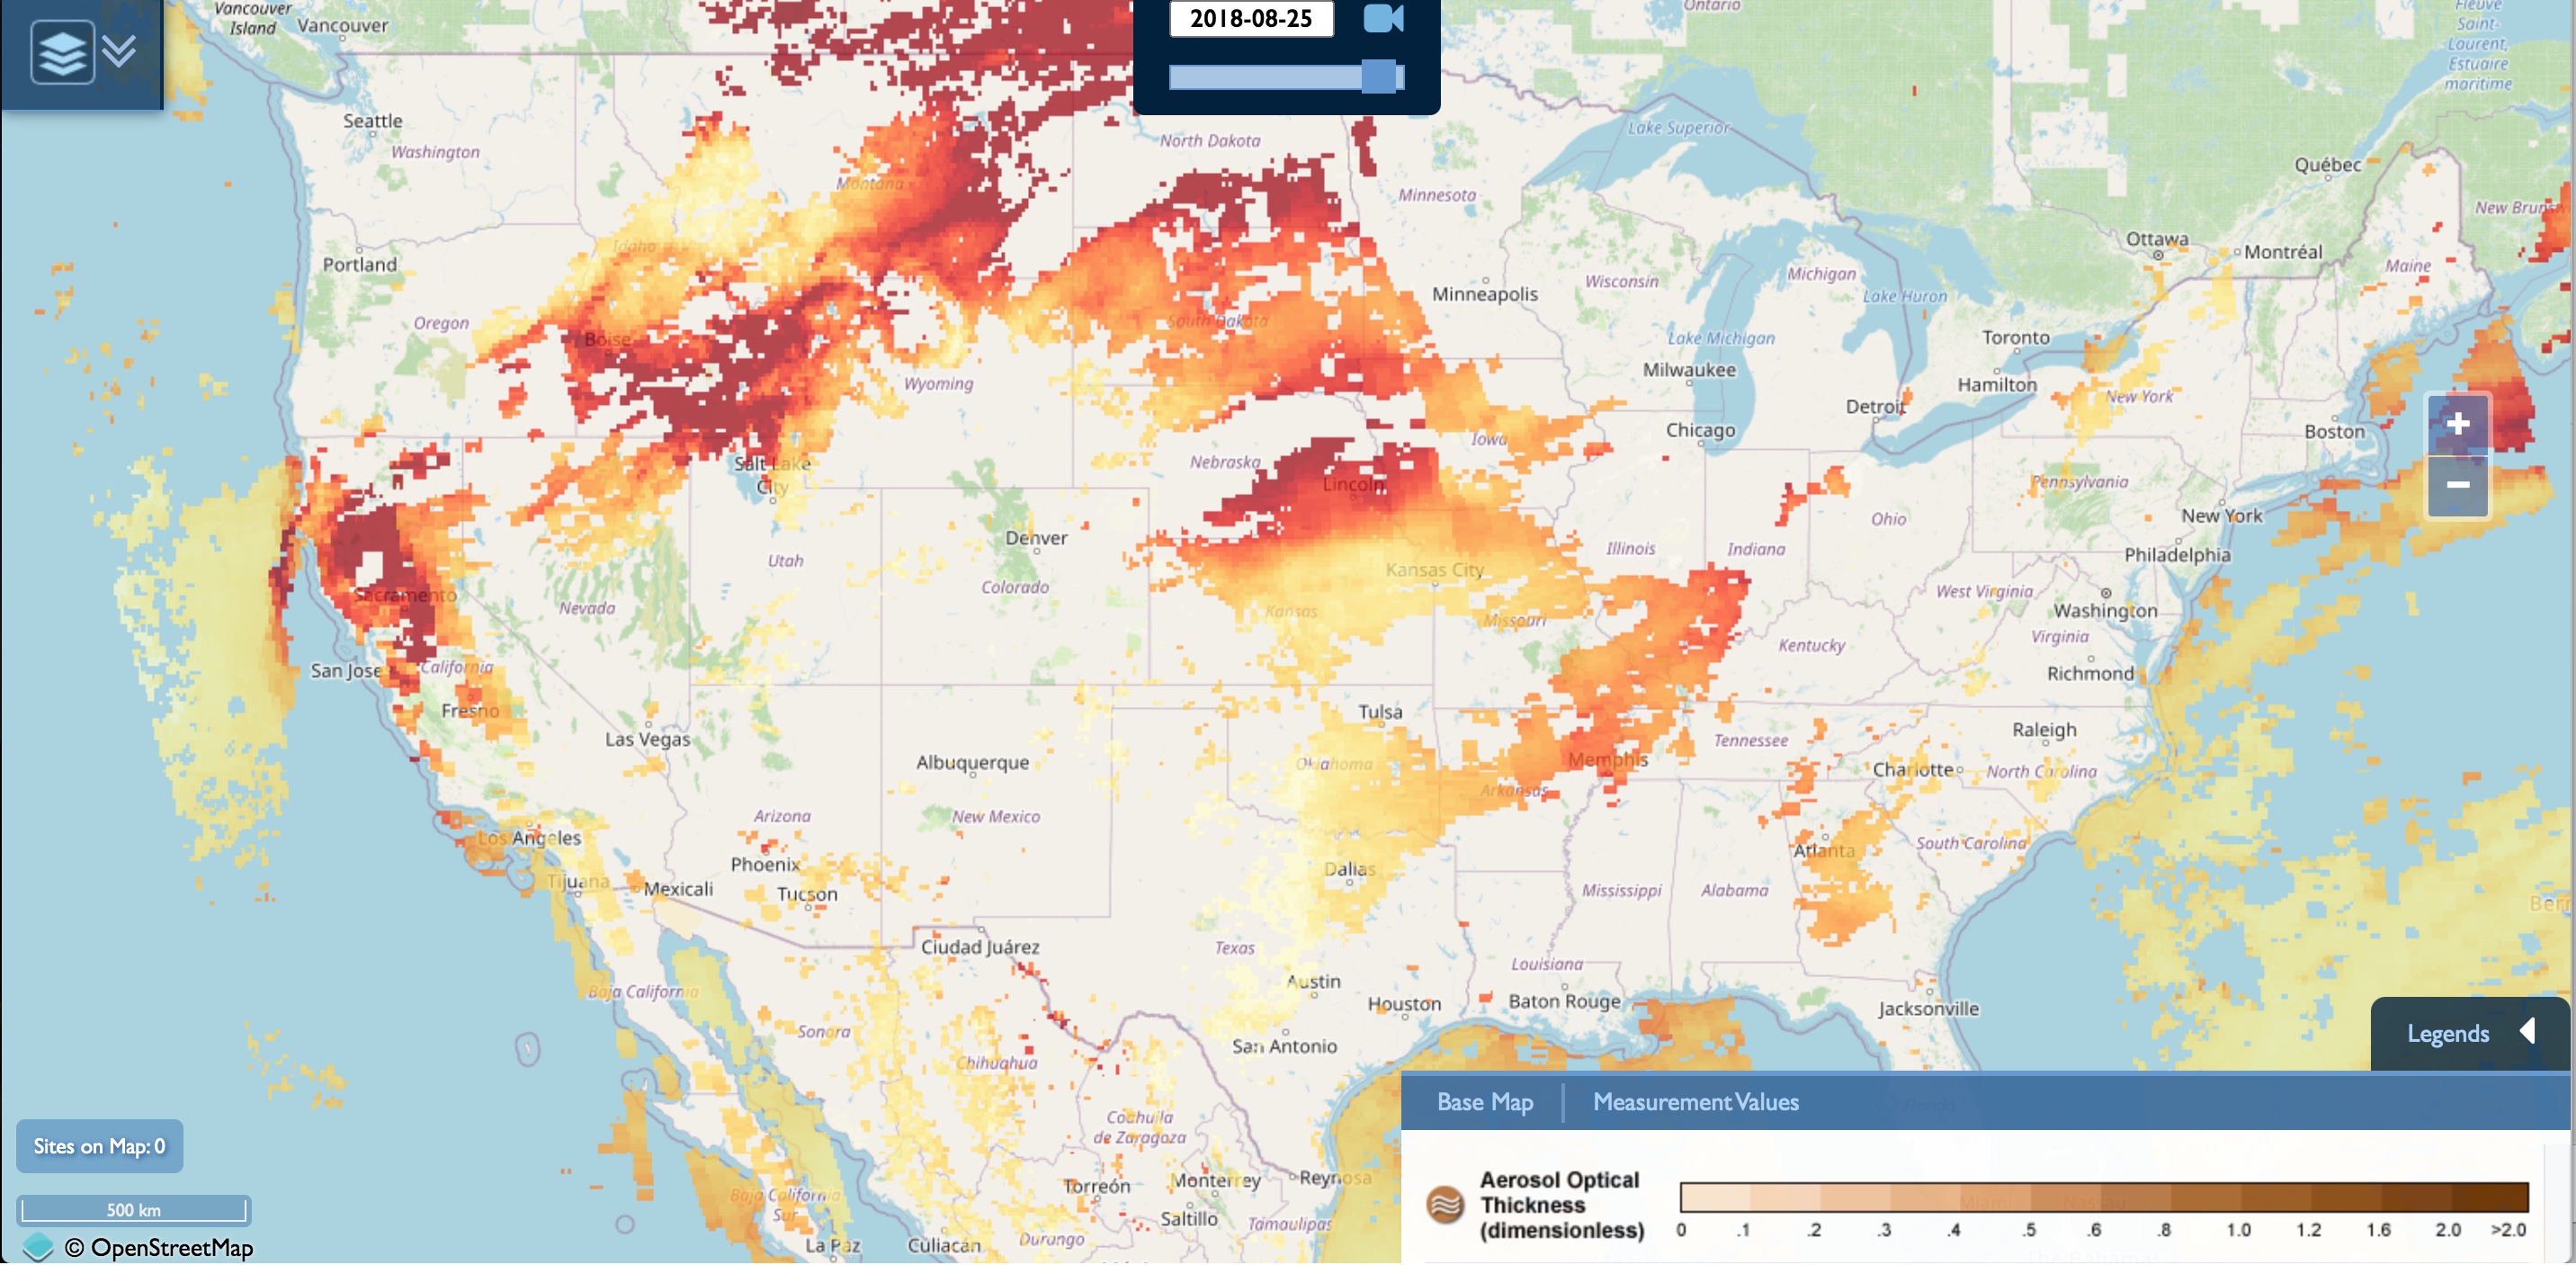
Below, we can see a map of AOT values around the Sunridge Middle School changing over the course of four days. As these values increase, the circular icon marking the school changes, becoming a darker brown color. Additionally, we can see a broader map of AOT values taken from the MODIS instrument aboard the Terra satellite. Notice how the regional air quality changes over time, with redder colors indicating higher AOT measurements.
|
August 22, 2018 |
August 23, 2018 |
|
August 24, 2018 |
August 25, 2018 |
Comparison of the Sunridge Middle School and MODIS AOT values shows a similar pattern in the area of Athena, Oregon from August 22 to August 25, 2018. Namely, we can see AOT values increase significantly from August 22 to August 23, then decrease to previous levels after August 24.
AerosolWatch Satellite Images - NOAA
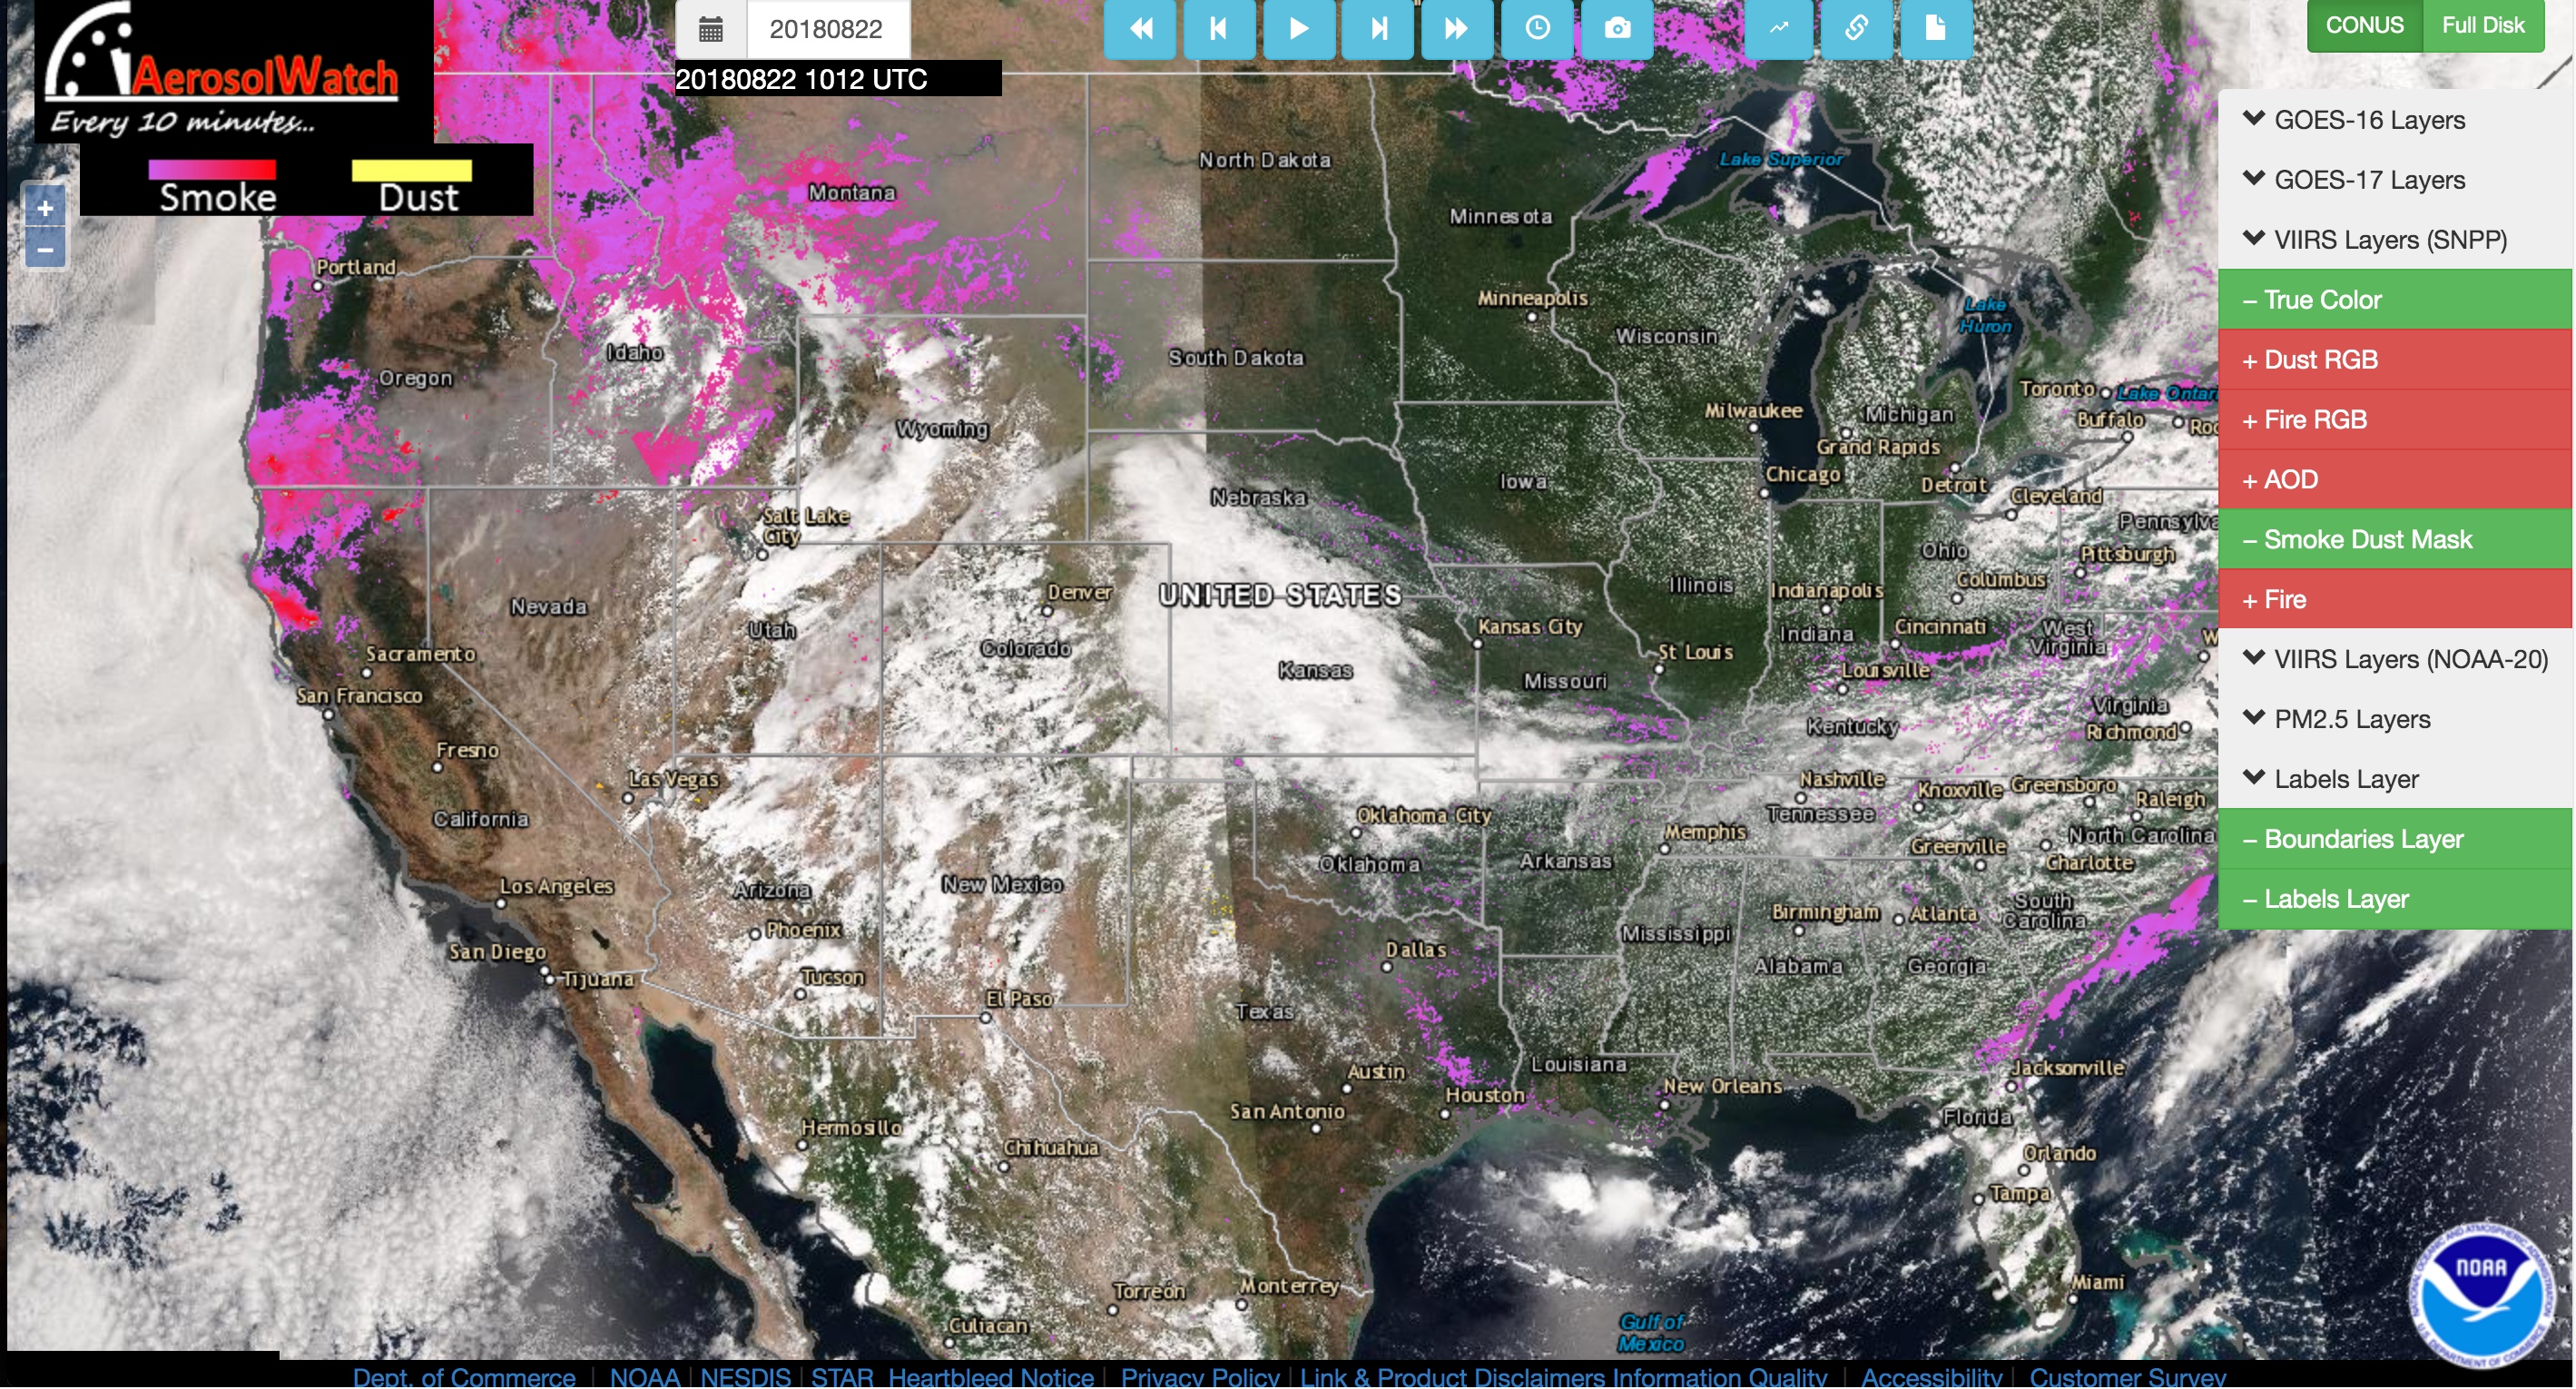
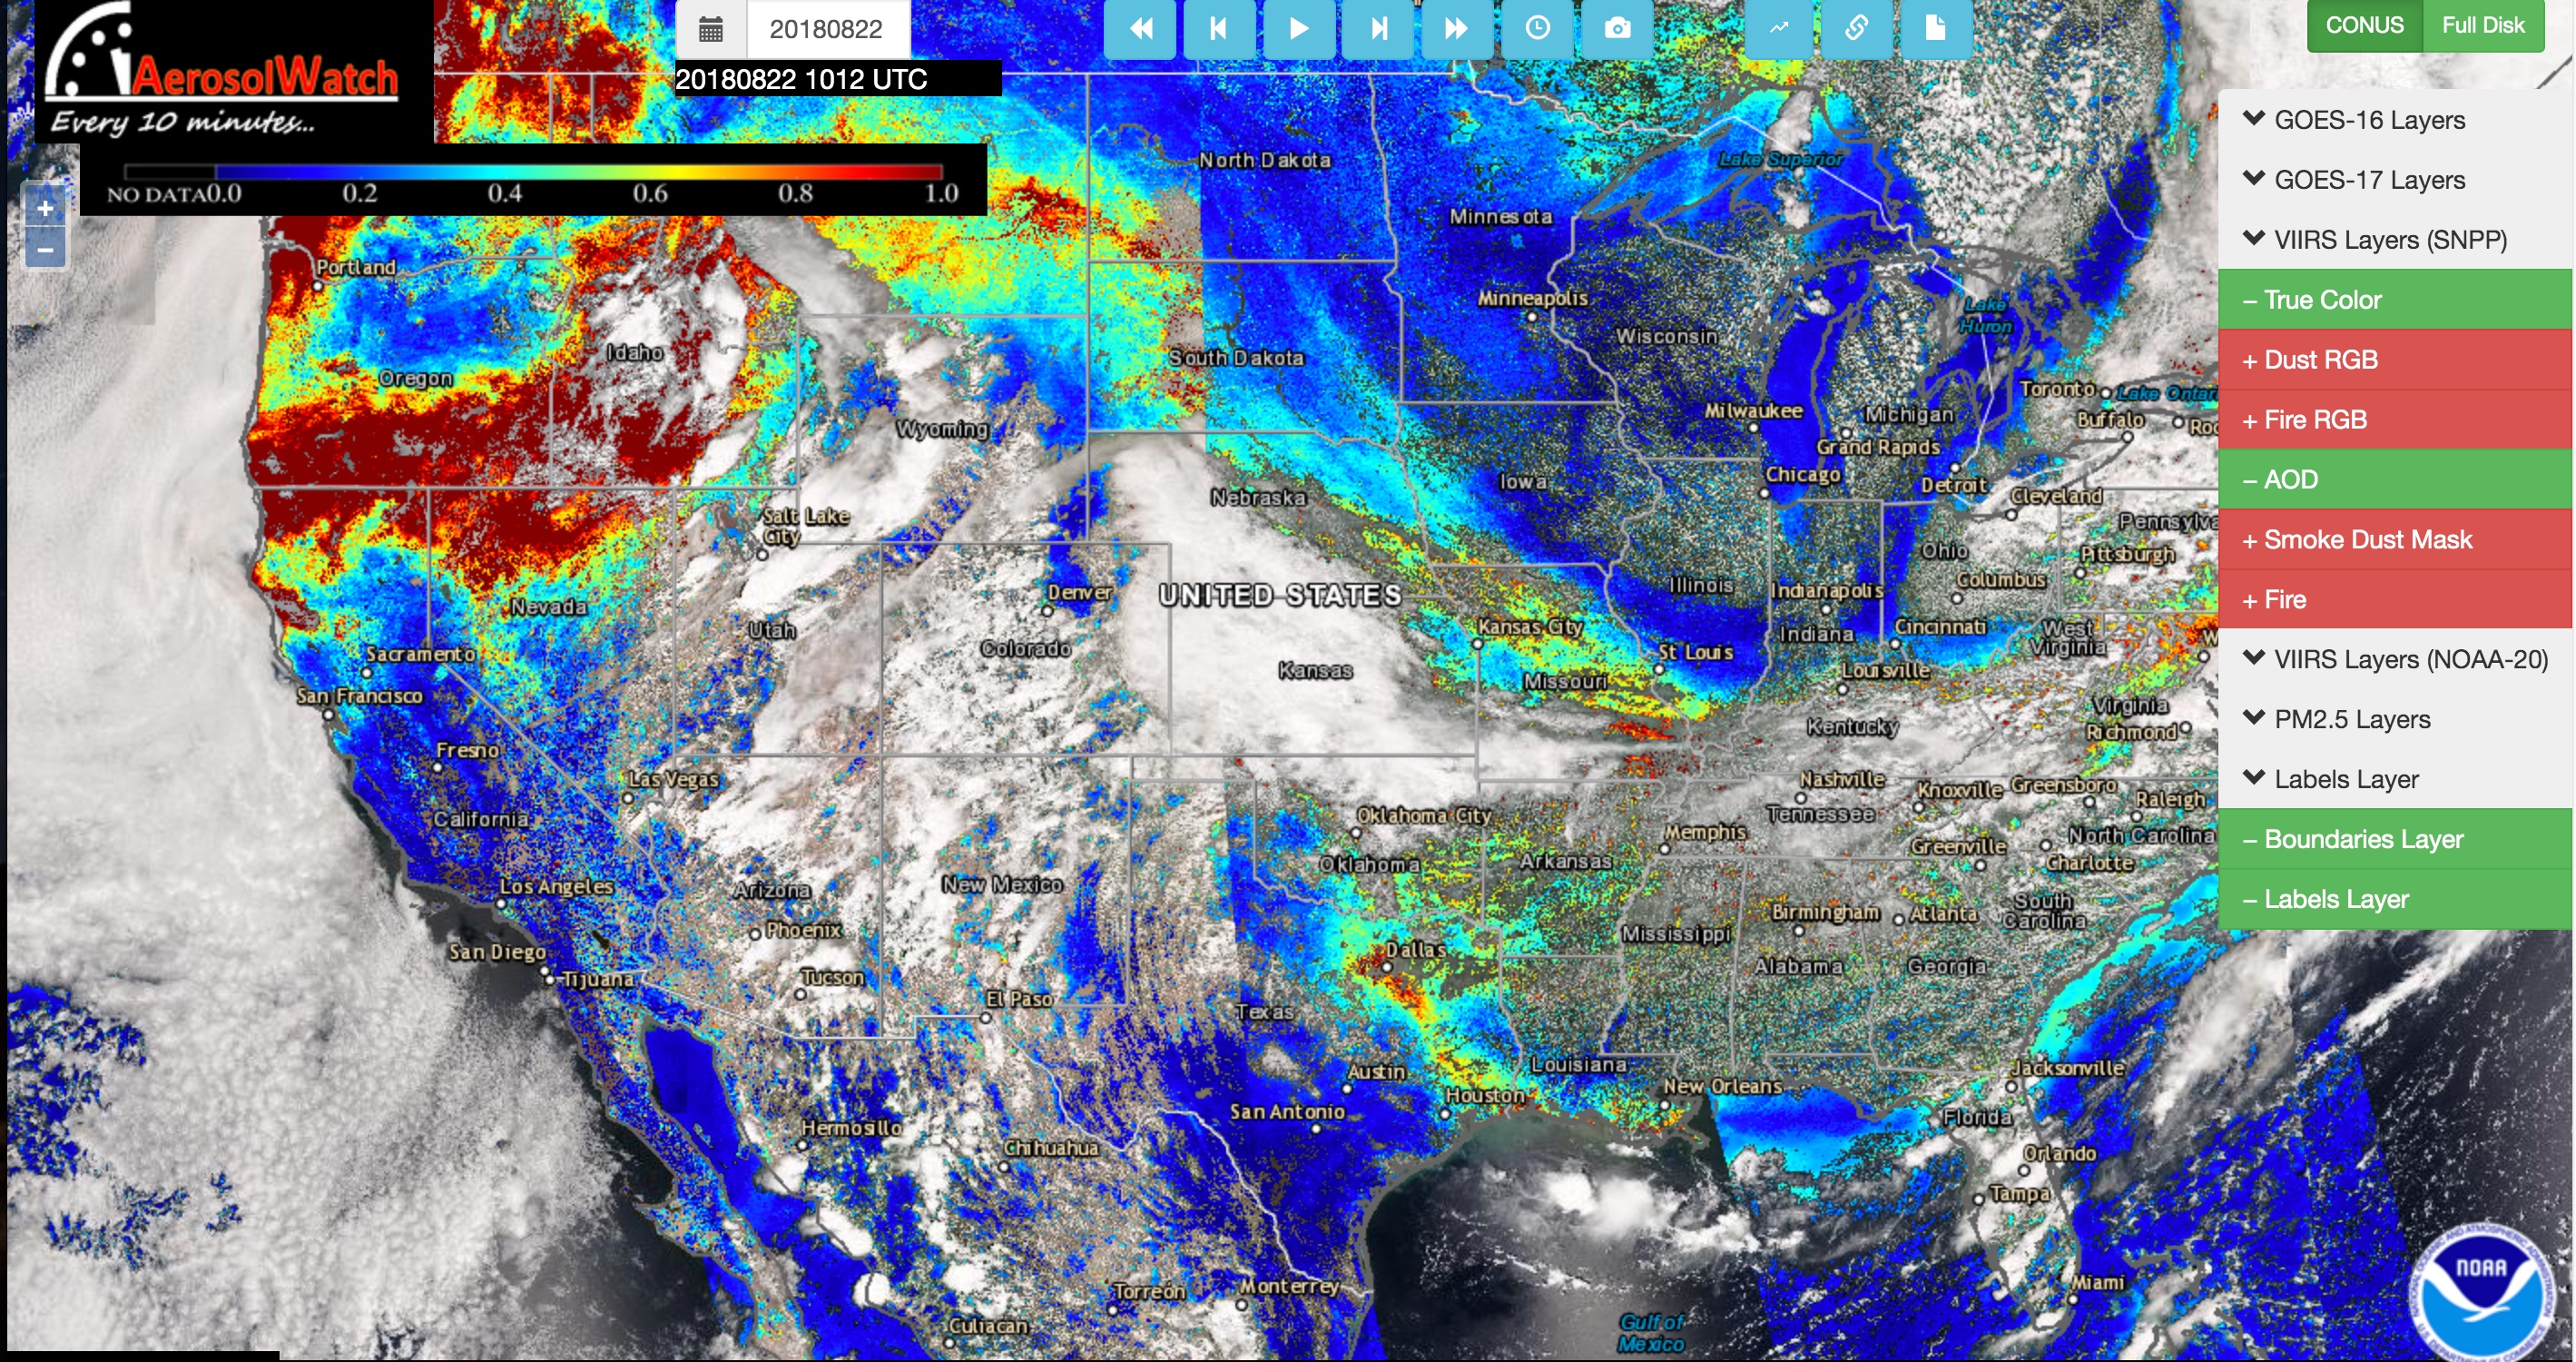
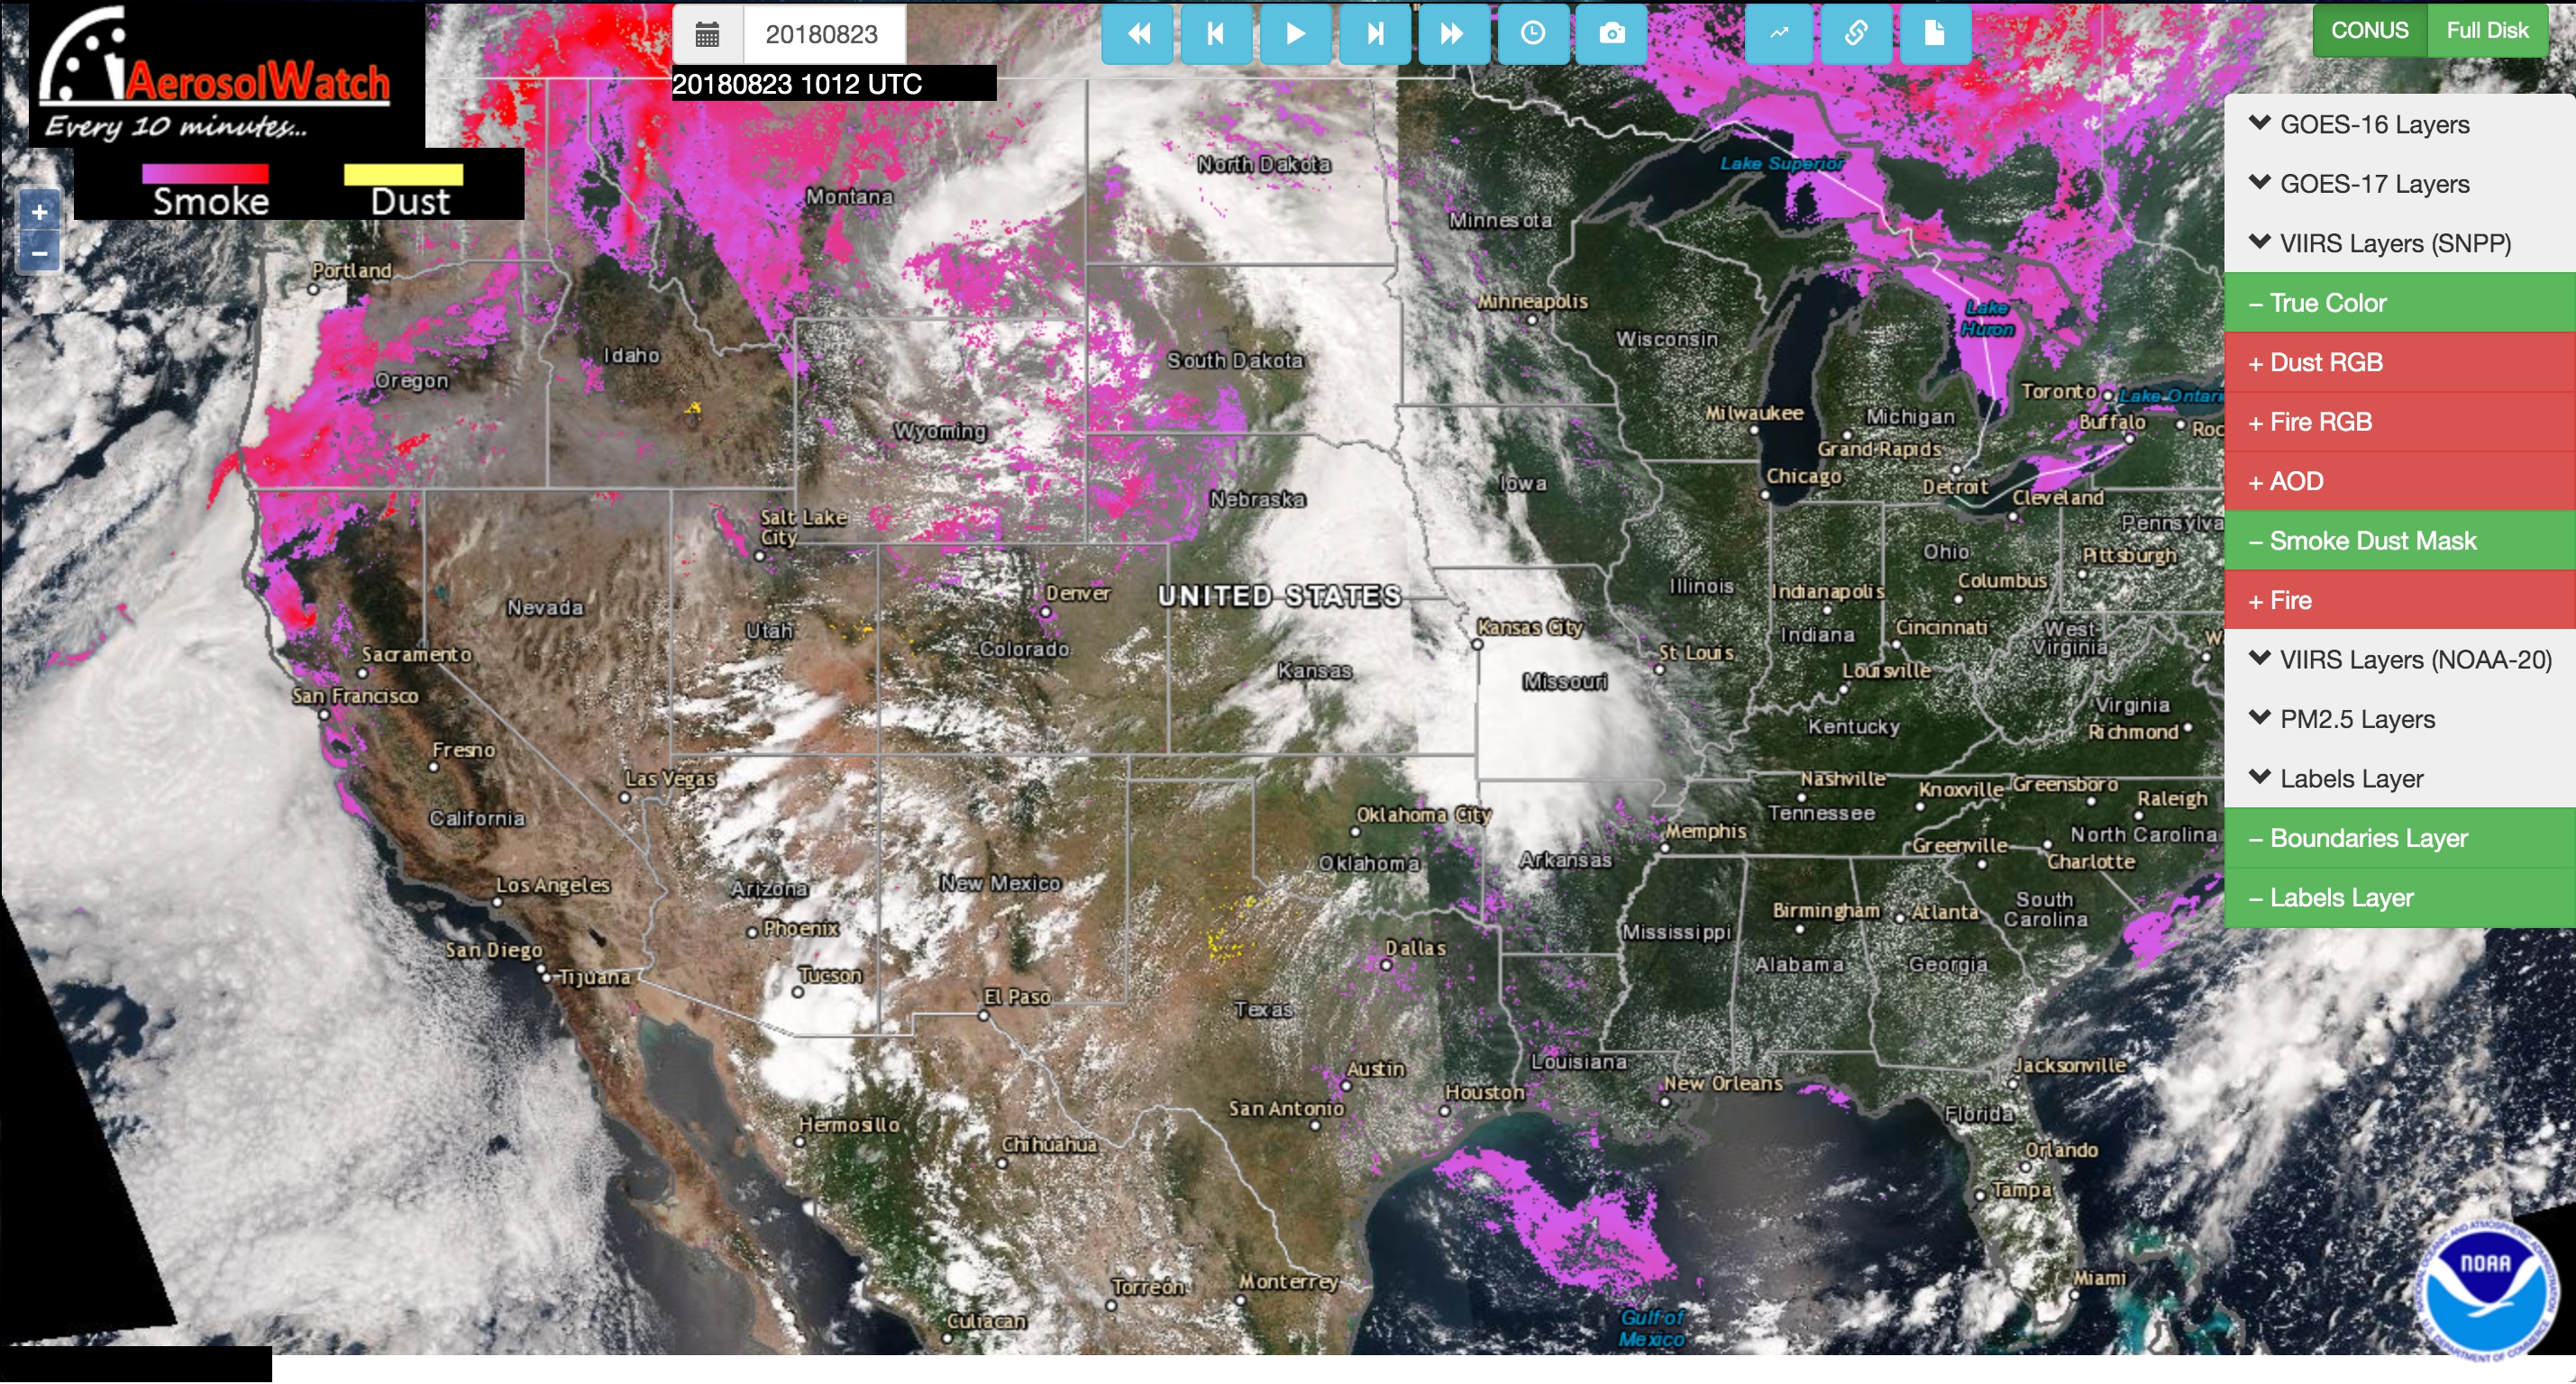
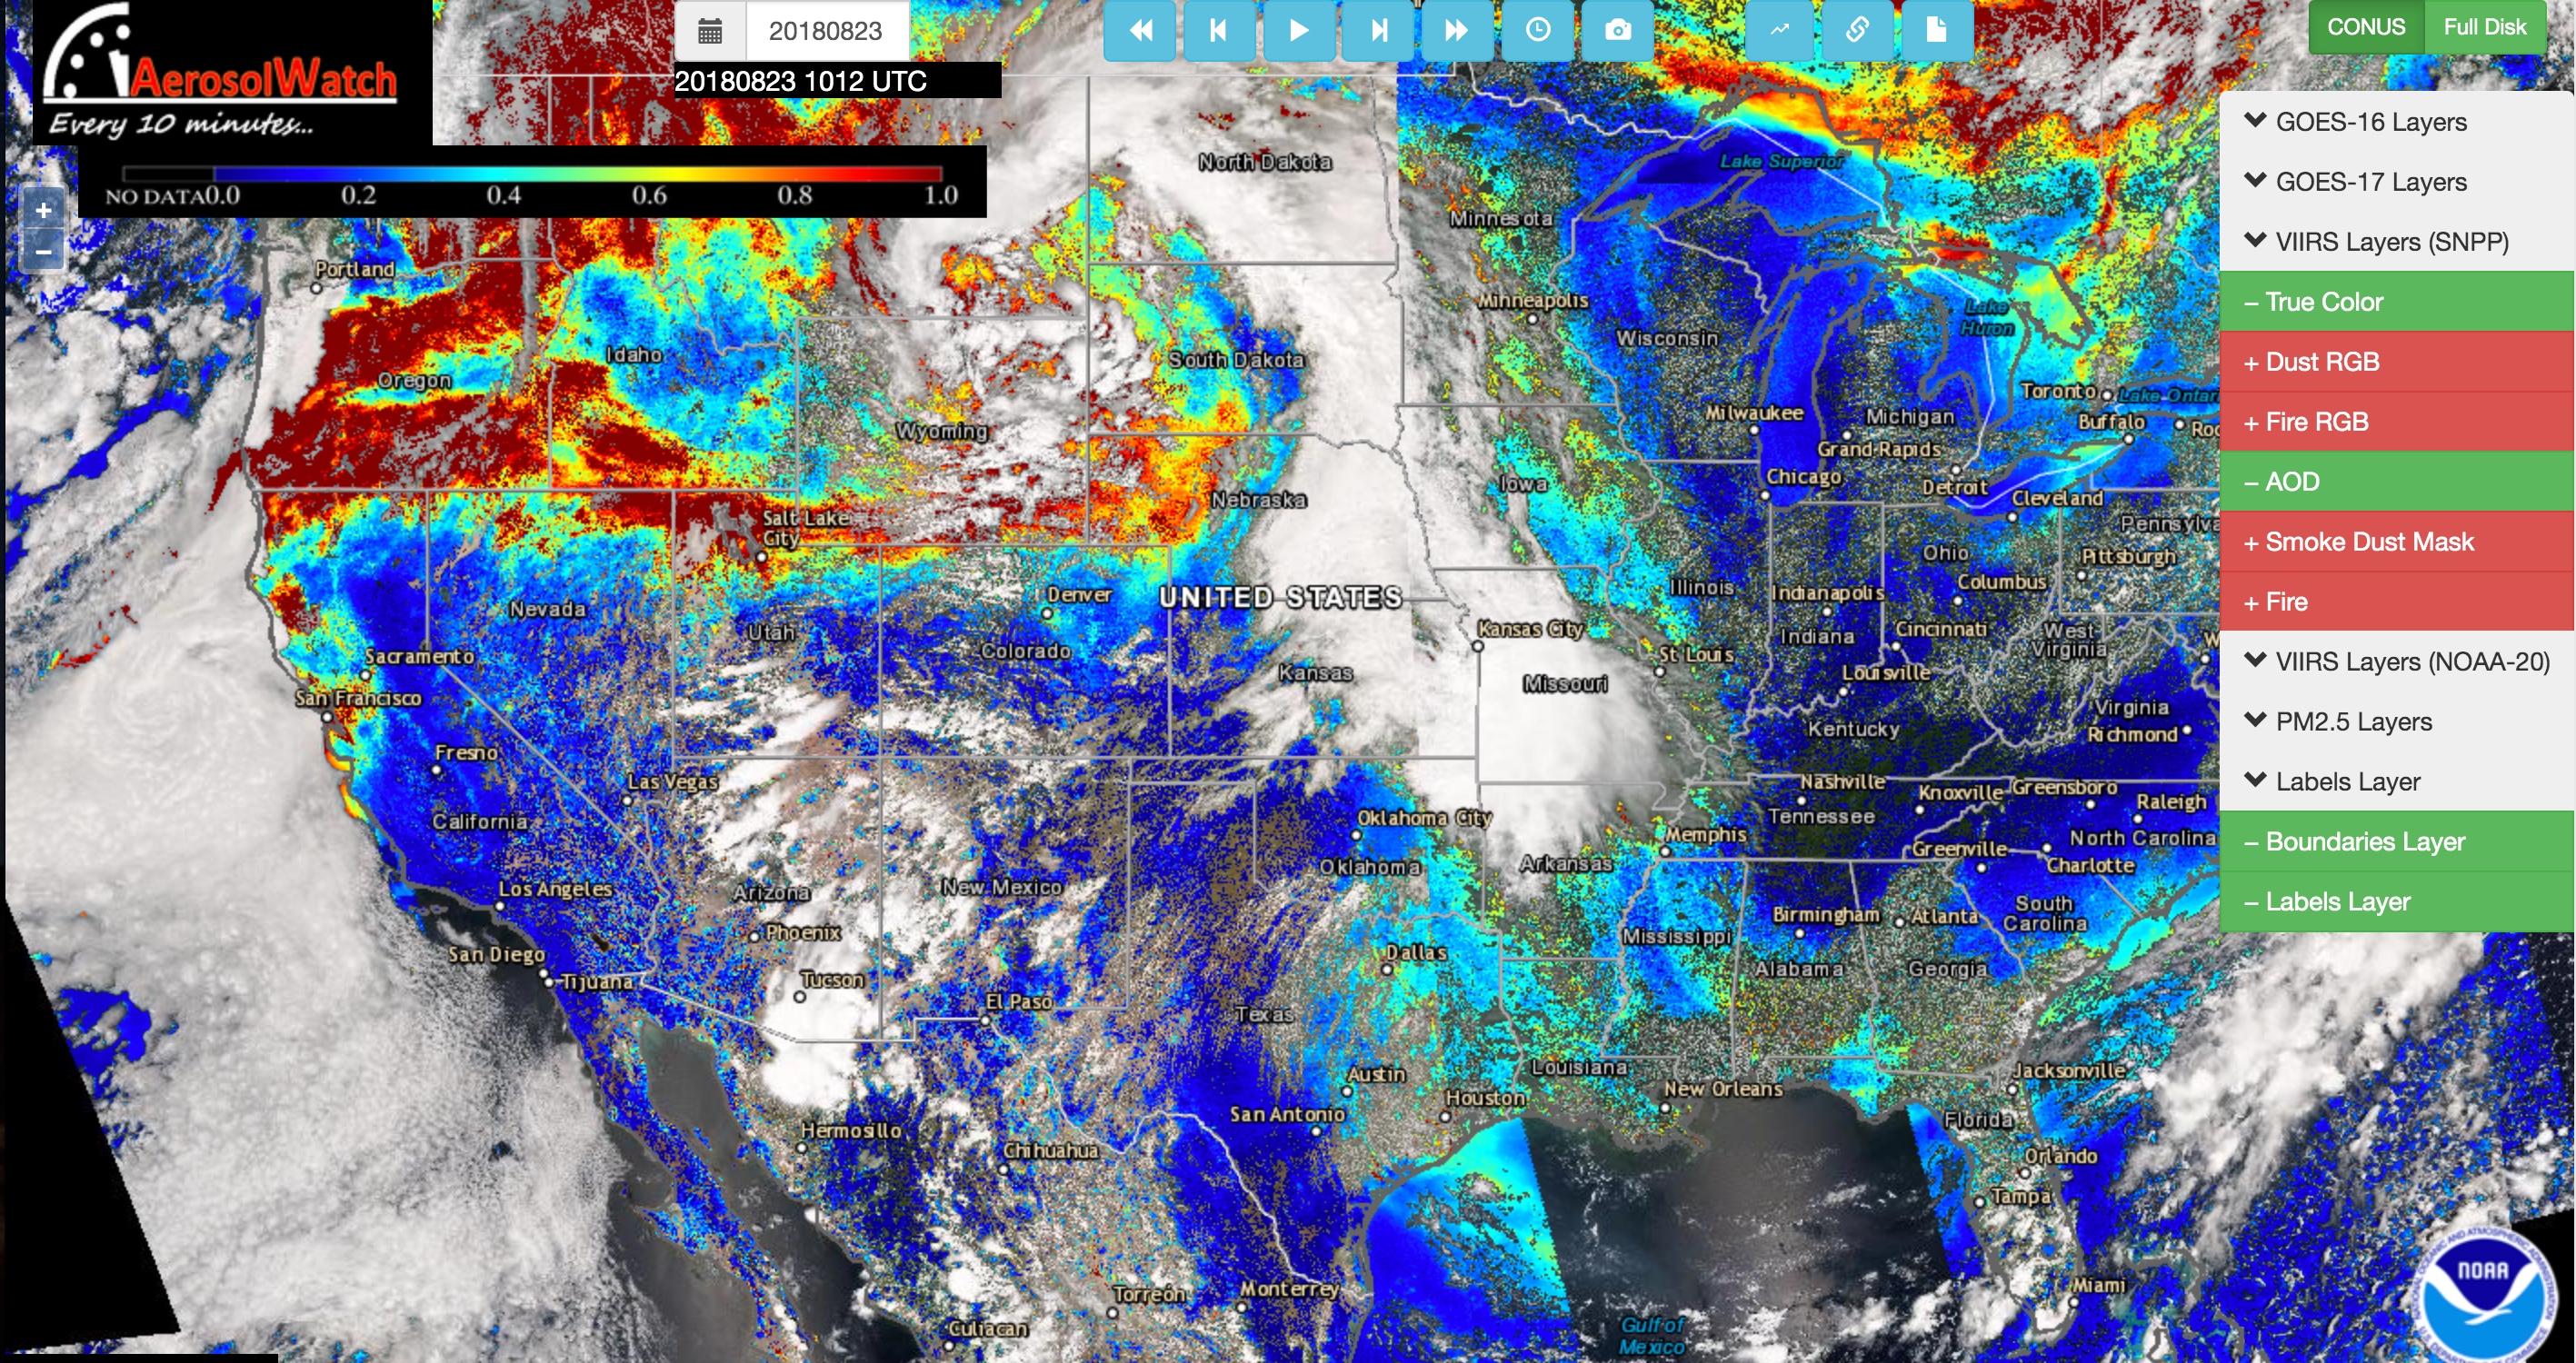
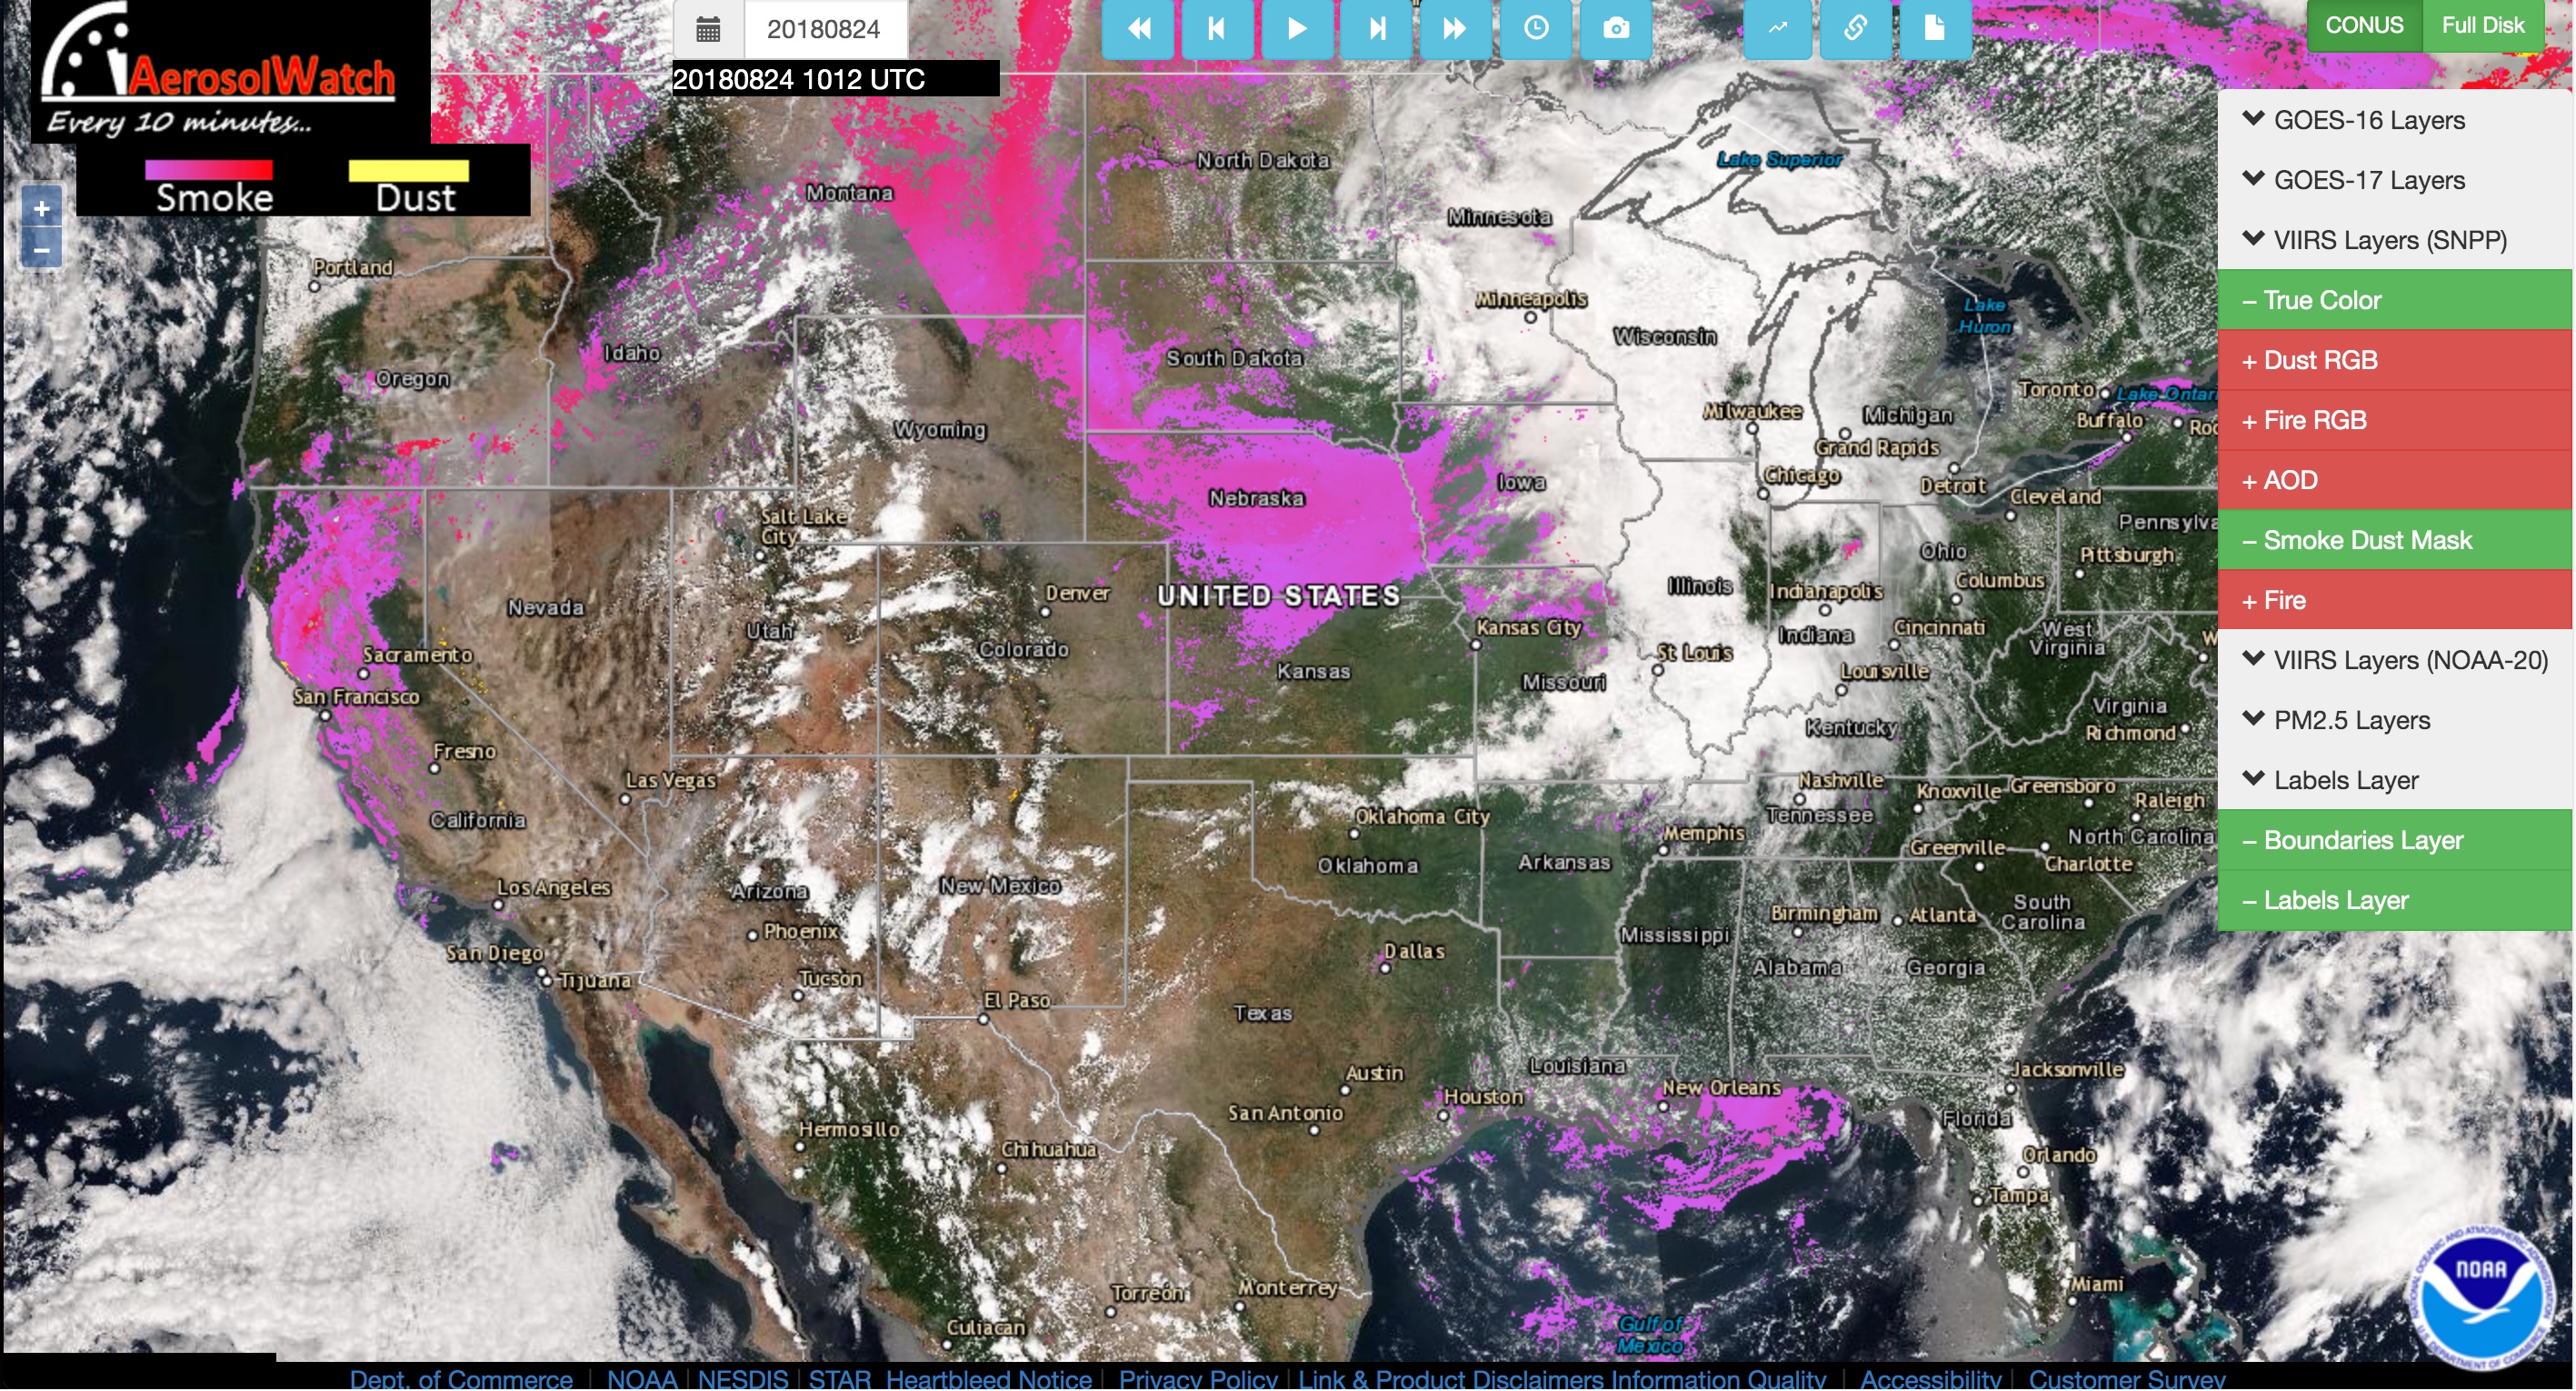
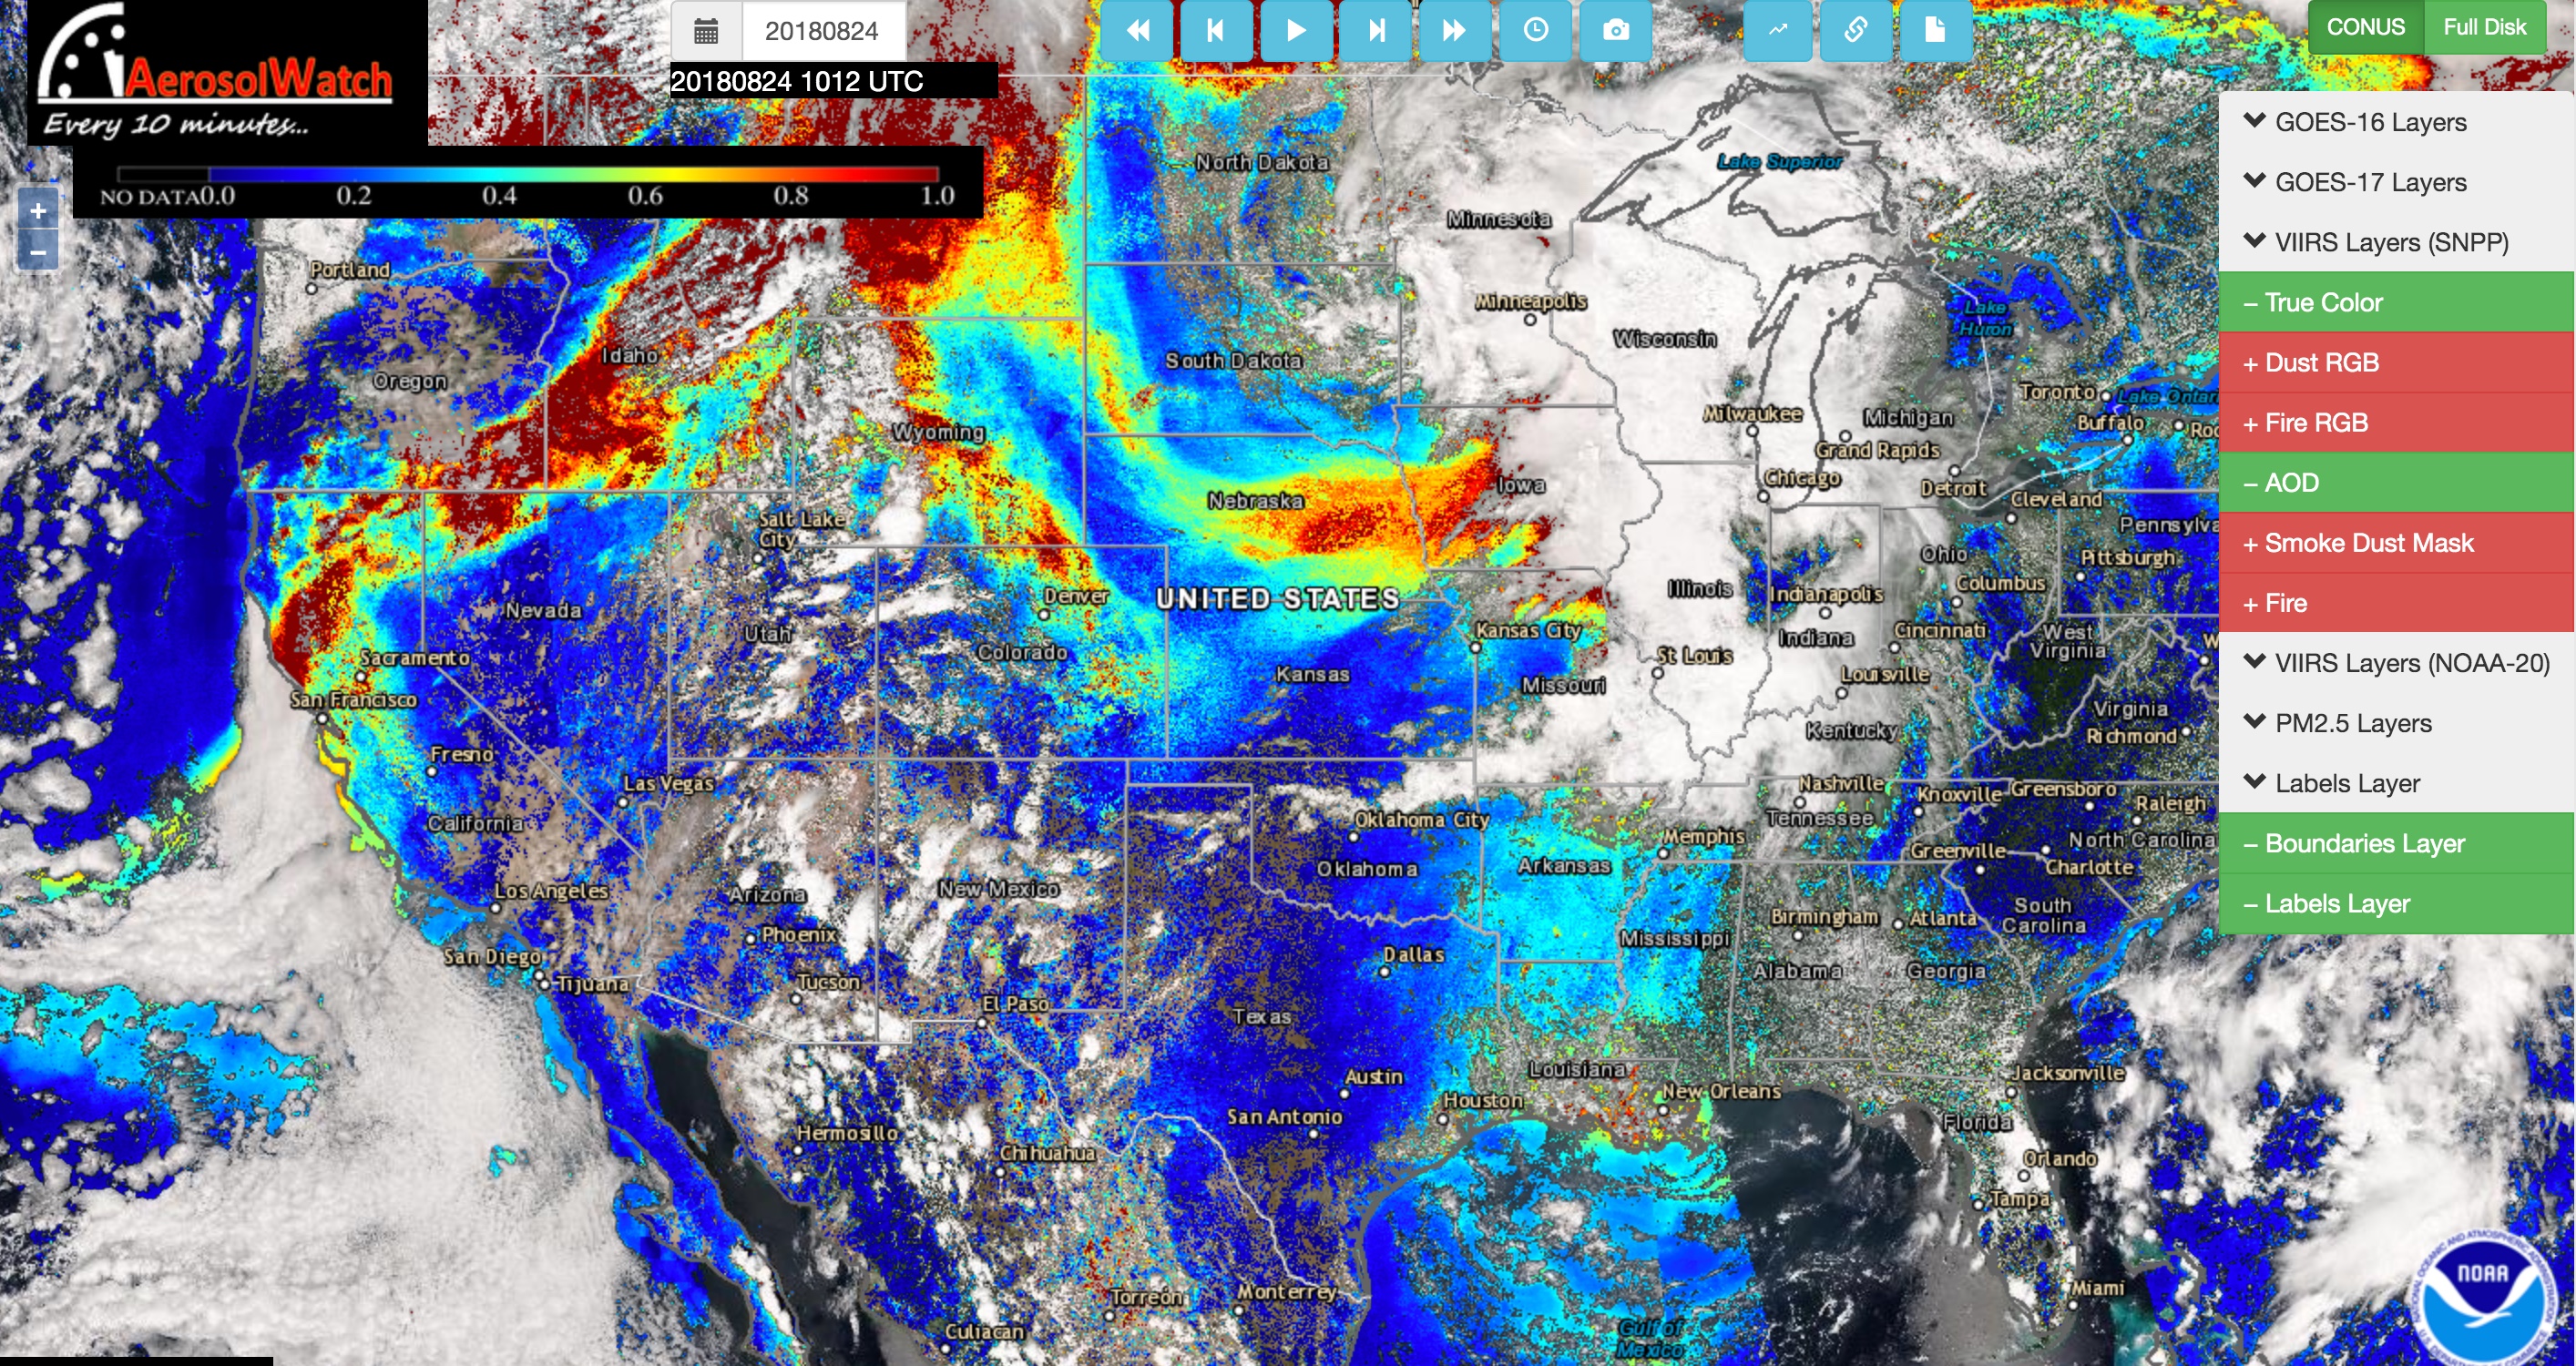
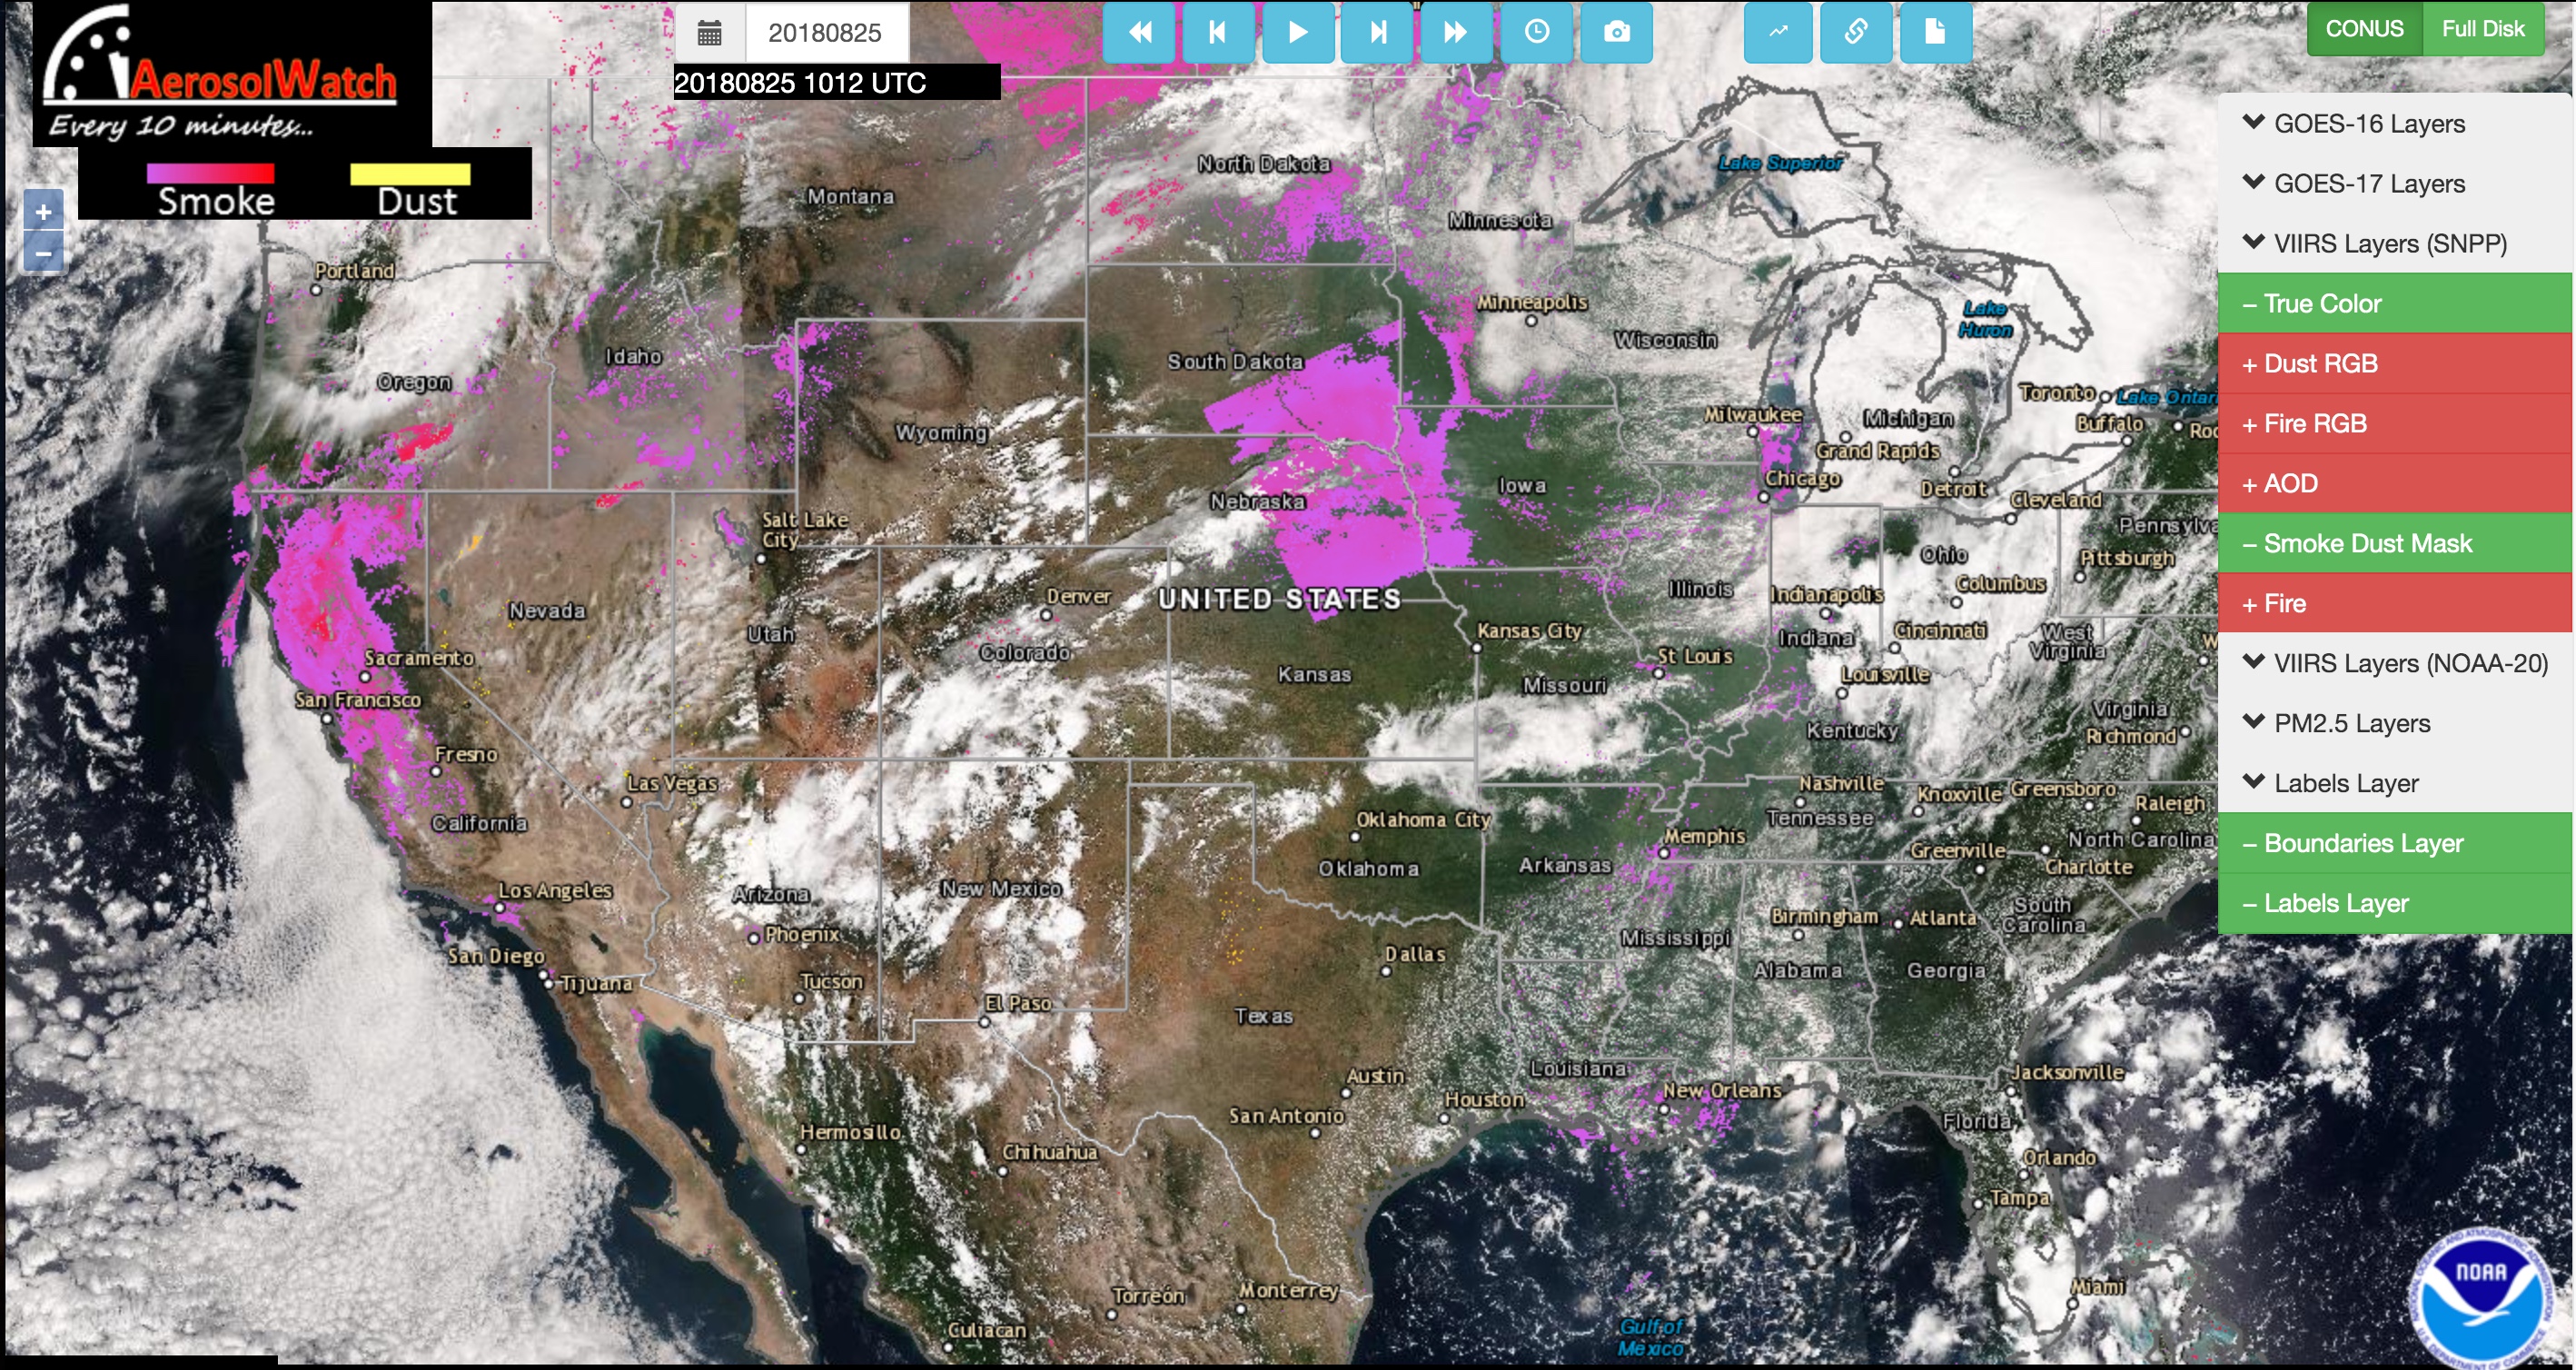
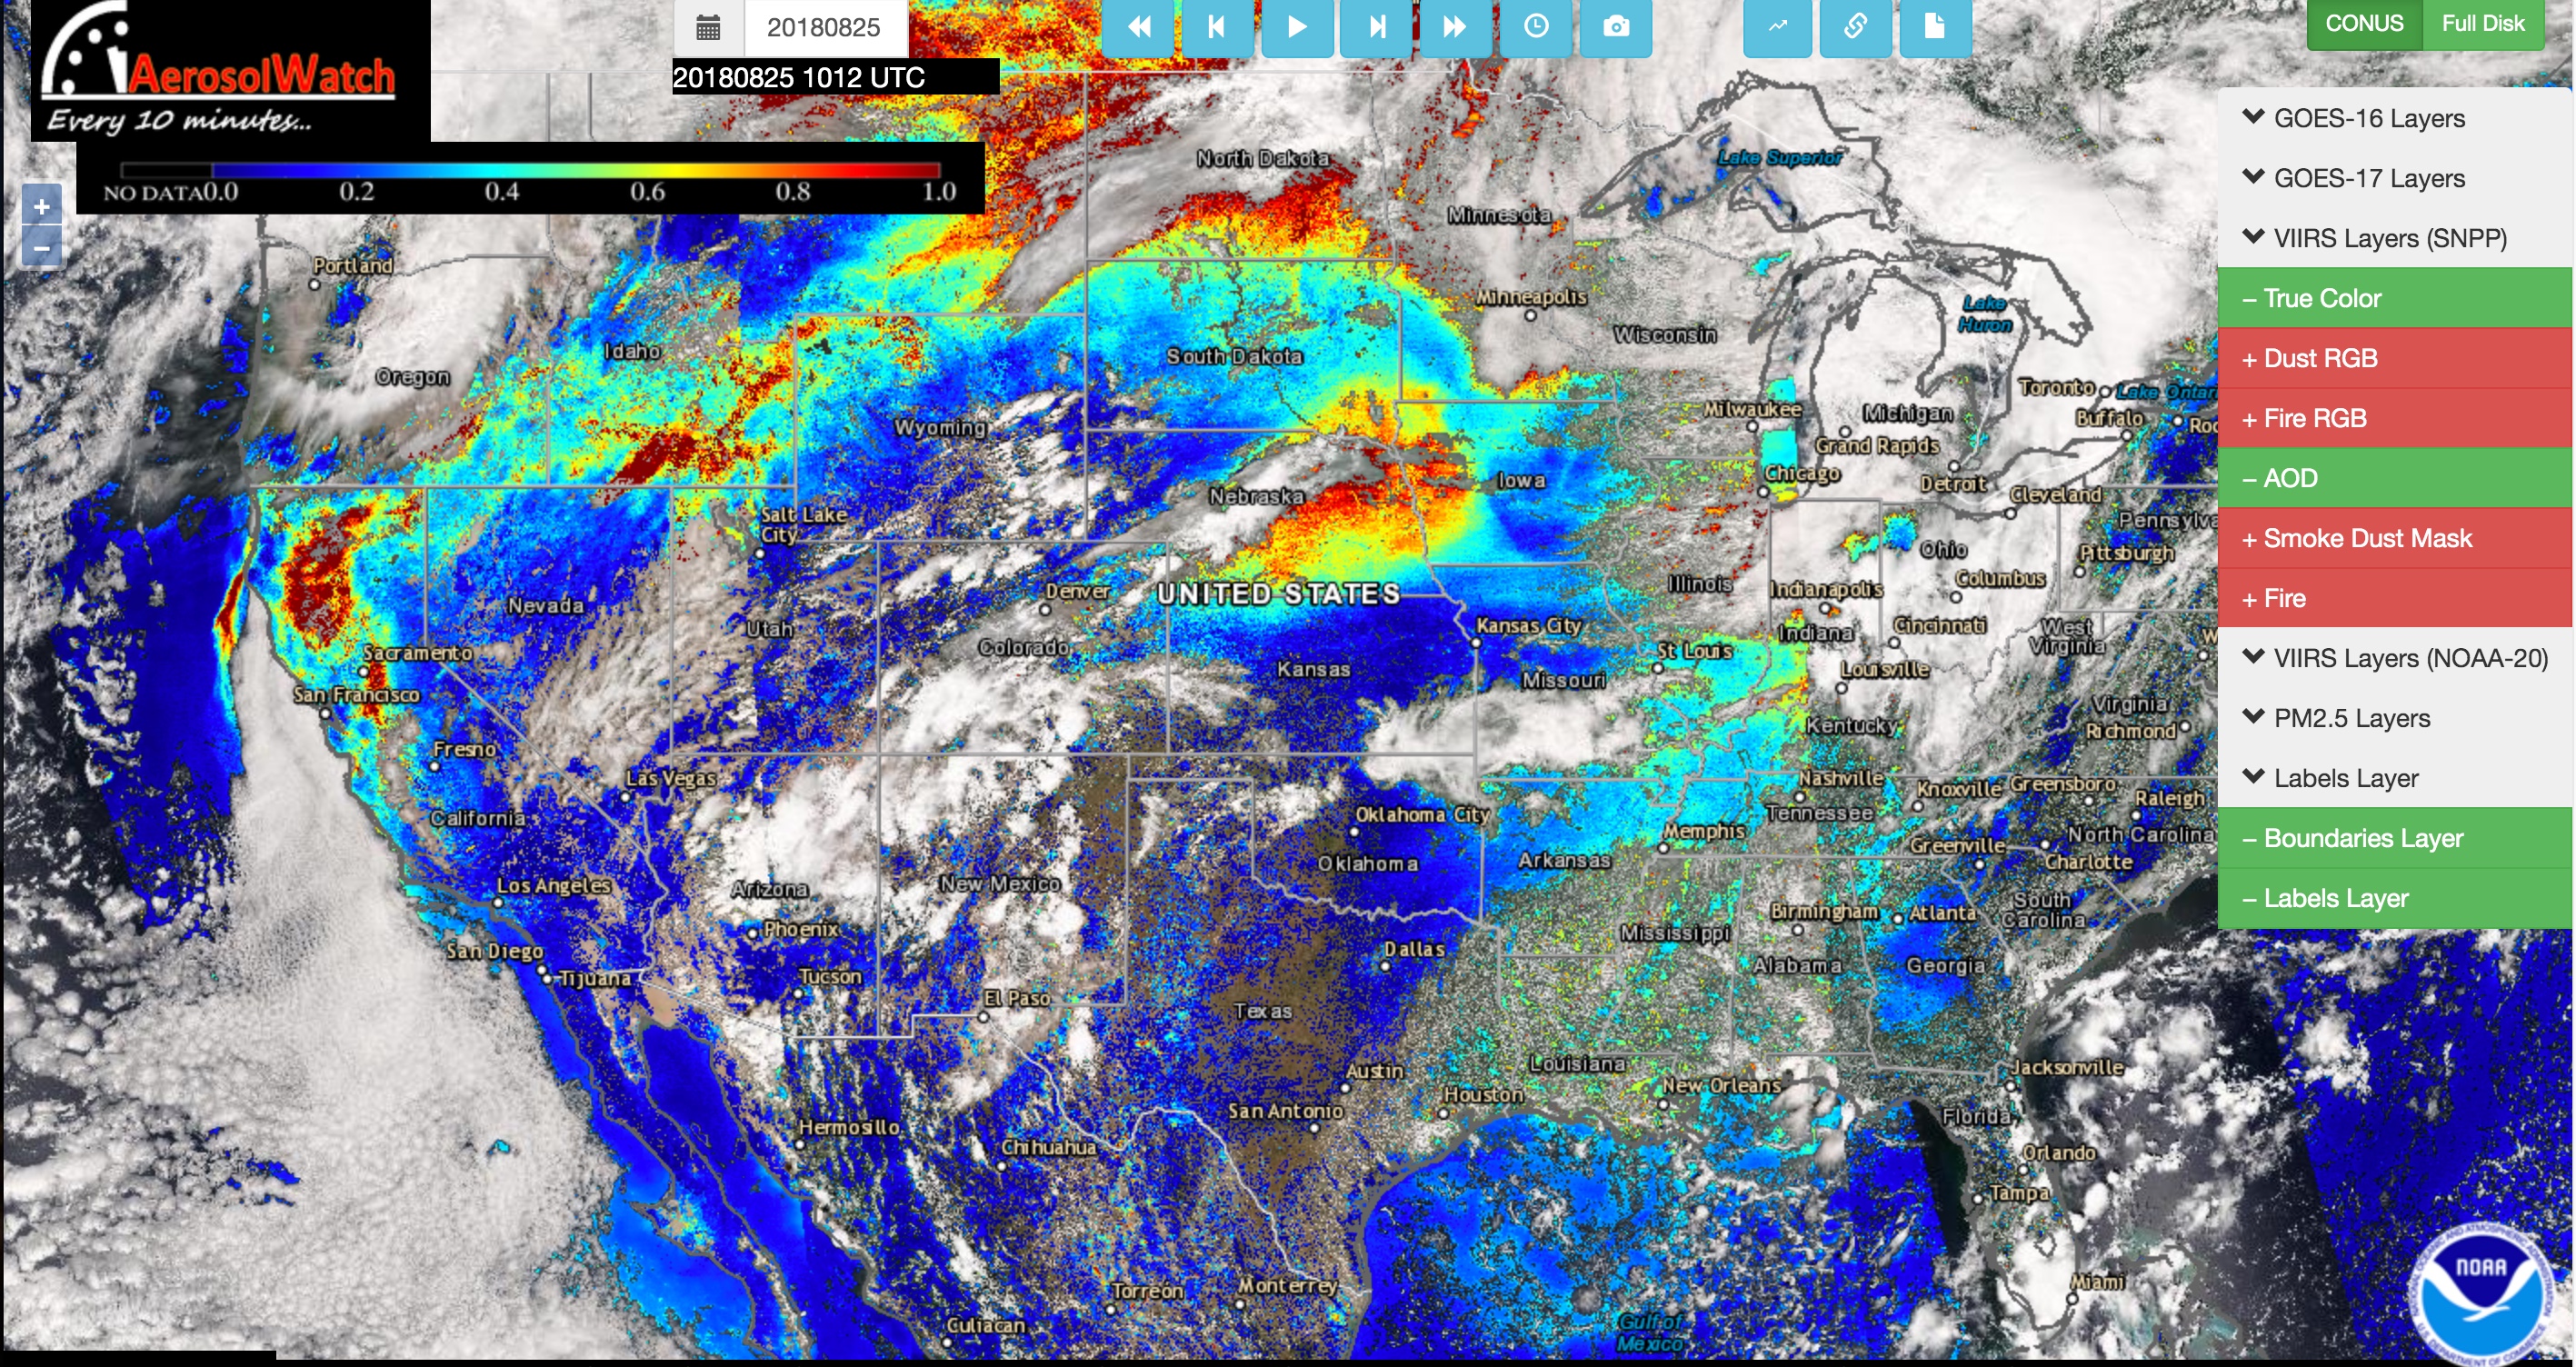
Further investigation with satellite data from NOAA’s AerosolWatch website indicates the presence of smoke in the western United States. This data was gathered by the Visible Infrared Imaging Radiometer Suite (VIIRS) instrument on board the Suomi NPP satellite. The VIIRS instrument can capture dust, smoke, and Aerosol Optical Depth—analogous to AOT—in true-color satellite imagery.
Therefore, in the images below, we can see that the Calitoo & MODIS AOT measurements taken above correlate with high amounts of smoke over the same timeframe. Thus, it's likely that the spike in AOT values observed at Sunridge Middle School over these four days were a result of wildfire smoke.
Note: For more sources of satellite-based aerosol measurements, check out NASA’s WorldView Site or NOAA's IDEA Site.
|
August 22, 2018 |
August 22, 2018 |
|
August 23, 2018 |
August 23, 2018 |
|
August 24, 2018 |
August 24, 2018 |
|
August 25, 2018 |
August 25, 2018 |
Air quality is a measure of the different elements in the atmosphere that can lead to what we call "clean" or "polluted" air. Monitoring air quality is important due to the impact polluted air can have on human and environmental health. When air quality is good, the air is clear and contains only trace amounts of solid particles and chemical pollutants. Conversely, poor air quality contains high levels of pollutants, is often hazy, and can be dangerous or disruptive to environmental systems.
Air quality can change rapidly from day to day, or even from hour to hour, because air is always moving. For any specific location, the air quality is a direct result of both how air moves through the area and how people are influencing the air in that area. That's why it's so important to keep track of the air quality in your local habitat.
Acknowledgements
GLOBE Air Quality Team:
-
Dr. Margaret Pippin, NASA
-
Angela Rizzi, NASA/SSAI
-
Samantha Adams, Bronx Collaborative High School
References
Environmental Protection Agency. (2018, March 8). Criteria Air Pollutants. https://www.epa.gov/criteria-air-pollutants
National Oceanographic and Atmospheric Association. (2020, 24 June). How is air quality measured? SciJinks. https://scijinks.gov/air-quality/
University Center for Atmospheric Research. (2020). How Weather Affects Air Quality. UCAR Center for Science Education. https://scied.ucar.edu/learning-zone/air-quality/how-weather-affects-air-quality
World Health Organization. (2020). Ambient air pollution: pollutants. Air Pollution. https://www.who.int/airpollution/ambient/pollutants/en/


