Urban Protocol Bundle - Earth as a System


Urban Protocol Bundle
The urban environment is a reflection of urban dynamics. These dynamics include the surface and atmosphere energy balance, the transfer of air masses, the dispersion of air pollutants, and the energy/heat fluxes between the surface-atmosphere interface.
The areas within urban space are heterogeneous with respect to building and population density, land use/cover, greenery, cooling sinks, the intensity and spatial dispersion of anthropogenic heating sources, rain run-off features, and more.

The Changing Urban Environment
Urban spaces are typically classified as areas of substantial human infrastructure and high population density. The combination of these two factors can significantly alter the local habitat's natural state and environmental cycles. Furthermore, urban environments can manifest in many different ways throughout the world depending on the available resources and culture of the people constructing it.
In recent years, however, there's been a shift in our perception of the urban environment. Today, we don't think of urban spaces as simply an agglomeration of buildings, but rather as a ‘living organism” that is constantly changing, mostly due to human intervention. With this newfound point of view, it's important to:
- Take note of individual and nested systems from the natural environment, the built environment, and the socio-economic environment.
- Define the physical, chemical, and environmental processes and interactions that influence and/or control the urban environment.
Given the many small-scale variations caused by the built environment, contributions from citizen scientists are particularly needed to adequately characterize the urban environment. Inside the Urban Bundle, you can find a collection of protocols, prompts, and projects related to these issues and their intersections with various Earth Spheres.
Bundle Overview

- Atmosphere
- Air Temperature
- Concrete and buildings found in cities and towns affect how much heat is radiated away from the Earth. This irradiated heat can affect local air temperatures which have cascading effects for other parts of the environment.
- Clouds
- The cloud cover over a city affects the land-air energy budget through many different parameters, like surface temperature, relative humidity, and precipitation. Conversely, cities can also affect the formation of local clouds by limiting evaporation and vegetative transpiration rates.
- Precipitation
- Areas covered with artificial, impervious materials like concrete or asphalt can experience higher flood risks from precipitation than more natural spaces.
- Surface Temperature
- Surface temperature is an important parameter for assessing the presence and intensity of the surface urban heat island. It's an essential factor for the estimation of the energy budget in an urban area because it controls the heat transfer from the ground to the air—also known as sensible heat.
- Relative Humidity
- Evaporation acts as a cooling mechanism for cities. However, impervious urban materials, like asphalt and concrete, don't retain water, so evaporation rates from surface and subsurface soils are drastically limited. Lower evaporation rates also impact the overall relative humidity in an urban environment.
- Air Temperature
- Biosphere
- Biometry
- By measuring the heights of the tree and vegetation canopy in urban environments, we can better understand how variables like surface temperature, humidity, and building heating loads are affected by greater or lesser amounts of natural shade.
- Land Cover
- Since cities replace natural, vegetative land cover with harder surfaces, it's important to know how these changes in material affect local temperatures, albedo, emission coefficients, and the land-air energy budget. This knowledge also helps guide us on the least ecologically impactful way to expand our urban environments.
- Biometry
- Hydrosphere
- Water Temperature
- The temperature of urban water bodies influences amount of airborne water vapor, and thus humidity, cloud cover, and precipitation. Higher temperatures typically lead to higher evaporation rates, while lower temperatures have the opposite affect.
- Water Temperature
- Pedosphere (Soil)
- Soil Characteristics
- The characteristics of urban soil are greatly influenced by human activity. For example, the materials comprising the soil can change significantly from their original form after a building or road construction project begins.
- Soil Infiltration
- Impervious urban materials typically have lower water infiltration rates, which can lead to higher risk of flooding after extreme precipitation events.
- Soil Moisture (Gravimetric)
- Through anthropogenic changes to land cover, soil characteristics, and the atmosphere, we are directly affecting the soil moisture content in urban areas. The water content of the soil has a significant impact on the areas biome type as well as the plants/animals that can live in that area.
- Soil Temperature
- By converting natural landscapes into urban ones, we affect the temperature of the soil beneath us. Changes in the soil's temperature has broad impacts on the underground ecosystem, and thus the environment on the surface.
- Soil Characteristics
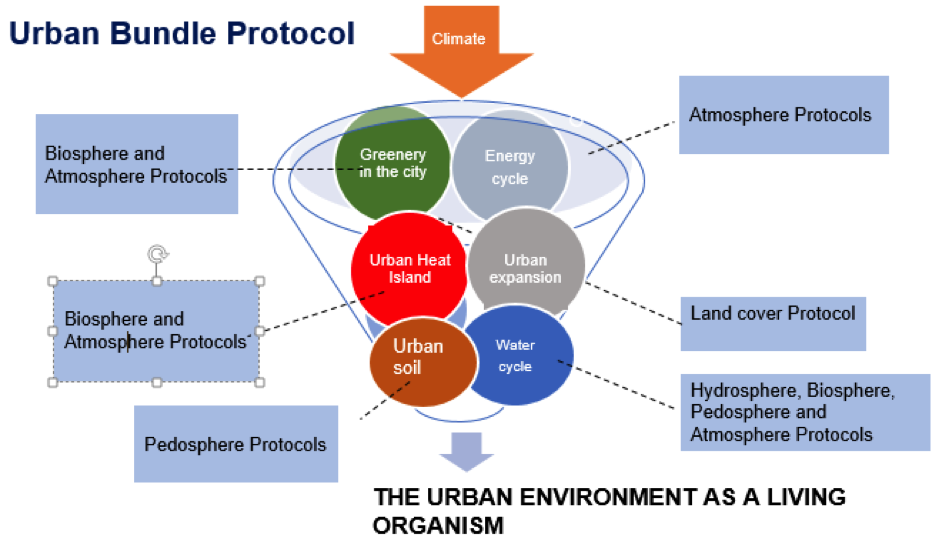
Check out our chart below for a visual representation on how all these protocols fit together within the Urban Bundle:
Urban areas comprise less than 3% of the Earth’s surface, however their proliferation has been largely driven by socio-economic factors with little consideration for their environmental impact. Today, a particularly important aspect for studies of urban environments is the lack of balance between natural and built spaces. These imbalances influence a host of other factors including, urban microclimatic changes, the depletion of green spaces, increases in anthropogenic heat sources, proliferations of impervious sources, deteriorated air quality, increase flooding and much more.
Air pollution and heat islands within urban ecosystems are especially crucial areas of study due to their negative impacts on human health. Air pollution impacts are exacerbated for members of vulnerable groups, while increased temperatures lead to more energy used for cooling. The latter can lead to poor city energy efficiency, intensified energy poverty, and greater disparities between socio-economic classes.
These two issues are mostly confined to medium- and large-size cities. However, the differences measured between urban and rural area can be quite significant. For example, air temperature measurements can raise by 6-8 degree Celsius as you move from the countryside into the built environment. Furthermore, poor urban planning can lead to temperature variations within the city itself, creating areas of excessive thermal intensity.
This intensified thermal heating is a result of the change in natural green spaces to hard environments with significant heat loads. Where forests or fields would cool the local area through evapotranspiration processes, urban settings lack the moisture to adequately cool the habitat through the same methods. Additionally, buildings have a strong impact on the flow of wind through the area and, in most cases, suppress the outgoing thermal radiation close to the ground.
Before taking measurements out in your local community, it's beneficial to first focus your approach by creating research questions. A few of these questions include:
- Does urbanization increase surface temperature?
- Does surface temperature have corresponding influence on air temperature increase?
- Does surface temperature have corresponding influence on soil temperature at a depth of 10 cm?
Effect of urbanization on surface, air, and soil temperature changes in Akure, Nigeria
Students: Folayan Favour, Dunbaiju Promise, Oluwaseyi Olamobisi
Mentors: Mr. Olawunmi Fasakin, Mrs. Oluremi Adeniyi
GLOBE School: St. Peter’s Unity Secondary School, Akure (SPUSSA), Ondo State
Level: Secondary School (grades 9-12, ages 14 – 18 years)
Introduction
The Earth atmospheric system has been seriously affected by different urbanization processes that greatly impacted natural ecosystem. These have influenced the evapotranspiration and the energy cycle. Data were collected from three observational sites (School Football Field, School Farm and Cement Floor) within SPUSSA study area. The objectives of this project are to evaluate the effect of urbanization and examine the influence of surface temperature on air temperature and soil temperature. These data are weekly surface land, air and soil temperatures for period of five months from October 2020 to February 2021. No soil temperatures were obtained from the Cement Floor. Cloud cover conditions were recorded. Data were analyzed using mean graph and analysis of variance (ANOVA) test. The general attributes of the surface and sky conditions are dry ground, leaves on trees, low moisture content, overcast, somewhat hazy sky visibility and opaque cloud opacity. The mean weekly graphs indicate increase surface land temperature, air temperature and soil temperature with time across the three selected sites. This implies increase of surface land, air and soil temperatures with urbanization, that is, increase surface temperature with increase air temperature and increase surface temperature with soil temperature. The ANOVA reveals significant effect of urban island heat effect (urban land transformation) on surface land, air and soil temperatures across the School Field, School Farm and Cement Floor, at probability p<0.05 and 5% error level, with significant values of 0.000 (for the three climatic variables on the School Farm); significant values of 0.004, 0.000 and 0.000 (for the three climatic variables on the School Farm), and significant values of 0.000 and 0.000 (for the two climatic variables). It is recommended that other climatic factors should be included for further studies to give a holistic view to effects of urban land transform in the study area.
Research Questions
-
Does urbanization increase surface temperature?
-
Does surface temperature have corresponding influence on air temperature increase?
-
Does surface temperature have corresponding influence on soil temperature at a depth of 10 cm?
Protocols
- Clouds
- Surface Temperature
- Soil Temperature
- Air Temperature
Results
The GPS Coordinates for the three observational sites are:
School Field coordinates N070 15’ 31.2”, E0050 11’ 03.4” with elevation 352 m and accuracy ±2 m.
School Farm coordinates N070 15’ 4.2”, E0050 10’ 53.8” with elevation 354 m and accuracy ±2 m.
Cemented Floor coordinates N070 15’ 34.7”, E0050 11’ 03.8” with elevation 352 m and accuracy ±2 m.
Samples of weekly data measurements and cloud cover conditions obtained from the School Field, School Farm and Cemented Floor are presented in Tables 1, 2 and 3.
Table 1: Data and Observations obtained from the School Field after Two Weeks.
|
Observation Spots |
Surface Temperature (°C) |
Air temperature (°C) |
Soil Temperature (°C) |
Cloud Cover conditions- Sky and Surface |
|
1 |
46.1 |
37.3 |
33.0 |
Dry ground, Leaves on trees. Moisture content: Low. Cloud Cover: Overcast. Sky colour: Pale Blue. Sky visibility: Somewhat hazy. Cloud Opacity: Opaque.
|
|
2 |
47.6 |
39.4 |
39.0 |
|
|
3 |
47.6 |
41.2 |
39.0 |
|
|
4 |
49.7 |
40.8 |
40.0 |
|
|
5 |
49.1 |
40.9 |
39.0 |
|
|
6 |
51.6 |
41.2 |
38.0 |
|
|
7 |
50.6 |
41.1 |
39.0 |
|
|
8 |
51.6 |
40.3 |
40.0 |
|
|
9 |
51.8 |
40.7 |
40.0 |
Table 2: Data and Observations obtained from the School Farm after Two Weeks.
|
Observation Spots |
Surface Temperature (°C) |
Air temperature (°C) |
Soil Temperature (°C) |
Cloud Cover conditions- Sky and Surface |
|
1 |
52.6 |
40.7 |
40.0 |
Dry ground, Leaves on trees. Moisture content: Low. Cloud Cover: Overcast. Sky colour: Pale Blue. Sky visibility: Somewhat hazy. Cloud Opacity: Opaque |
|
2 |
50.6 |
41.5 |
38.0 |
|
|
3 |
49.5 |
40.8 |
40.0 |
|
|
4 |
47.7 |
40.1 |
38.0 |
|
|
5 |
53.4 |
40.8 |
37.0 |
|
|
6 |
51.8 |
41.4 |
39.0 |
|
|
7 |
48.3 |
41.3 |
39.0 |
|
|
8 |
49.8 |
41.1 |
38.0 |
|
|
9 |
49.9 |
41.1 |
37.0 |
Table 3: Data and Observations obtained during the Cemented Floor after Eight weeks.
|
Observation spots |
Surface Temperature (°C) |
Air Temperature (°C) |
Cloud Cover conditions- Sky and Surface |
|
1 |
47.5 |
32.5 |
Dry ground, Leaves on trees. Moisture content: Low. Cloud Cover: Overcast. Sky colour: Milky. Sky Visibility: Somewhat hazy. Cloud Opacity: Opaque. |
|
2 |
47.4 |
38.1 |
|
|
3 |
48.2 |
37.9 |
|
|
4 |
48.9 |
38.1 |
|
|
5 |
47.6 |
38.4 |
|
|
6 |
48.6 |
38.6 |
|
|
7 |
48.2 |
38.8 |
|
|
8 |
43.7 |
38.2 |
|
|
9 |
51.6 |
39.5 |
The average values of the three climatic factors (Surface temperature, Air temperature and Soil temperature at a depth of 10 cm) obtained during the period of the study from the three observation sites are shown in Tables 4, 5 and 6.
Table 4: Average values of Surface temperature, Air temperature and Soil temperature at a depth of 10 cm obtained from the School Field during the period of the Research.
|
Average School Field Data Measurements |
|||
|
Weeks |
Surface Temperature (0C) |
Air Temperature (0C) |
Soil Temperature (0C) |
|
2 |
49.5 |
41.5 |
39.9 |
|
4 |
48.5 |
40.2 |
38.2 |
|
6 |
48.3 |
36.4 |
38.1 |
|
8 |
50.1 |
36.9 |
40.2 |
|
10 |
50.4 |
38.4 |
36.7 |
|
12 |
45.6 |
35.6 |
34.3 |
|
14 |
45.3 |
35.7 |
36.9 |
|
16 |
50.4 |
35.3 |
36.6 |
|
18 |
52.4 |
36.7 |
40.2 |
|
20 |
51.2 |
36.7 |
39.3 |
Table 5: Average values of Surface temperature, Air temperature and Soil temperature at a depth of 10 cm obtained from the School Farm during the period of the Research.
|
Average School Farm Data Measurements |
|||
|
Weeks |
Surface Temperature (0C) |
Air Temperature (0C) |
Soil Temperature (0C) |
|
2 |
50.4 |
41.0 |
38.4 |
|
4 |
49.1 |
38.4 |
34.7 |
|
6 |
49.7 |
38.8 |
36.9 |
|
8 |
51.0 |
41.2 |
40.7 |
|
10 |
51.7 |
40.3 |
39.6 |
|
12 |
48.8 |
37.6 |
37.4 |
|
14 |
51.3 |
38.4 |
38.7 |
|
16 |
53.0 |
40.2 |
40.3 |
|
18 |
54.1 |
40.7 |
42.7 |
|
20 |
53.5 |
40.3 |
42.9 |
Table 6: Average values of Surface temperature and Air temperature obtained from the Cement Floor during the period of the Research.
|
Average Cemented Floor Data Measurements |
||
|
Weeks |
Surface Temperature (0C) |
Air Temperature (0C) |
|
2 |
40.1 |
34.7 |
|
4 |
47.8 |
38.4 |
|
6 |
46.9 |
35.8 |
|
8 |
48.0 |
37.8 |
|
10 |
48.0 |
37.9 |
|
12 |
43.1 |
35.4 |
|
14 |
44.9 |
37.3 |
|
16 |
44.3 |
37.6 |
|
18 |
47.4 |
39.8 |
|
20 |
47.4 |
39.5 |
Figures 12 and 13 show the average or mean graphs of the Surface, Air and Soil Temperatures against time over the School Field and School Farm Observational Sites within the Study Area; while Figure 14 displays the average or mean graph of the Surface and Air temperatures against time over the Cemented Floor Observational Site within the Study Area.
|

|
|

|

|
|
Table 7: ANOVA Result for the School Field |
||||||
|
|
Sum of Squares |
df |
Mean Square |
F |
Sig. |
|
|
Surface Temperature |
Between Groups |
447.420 |
9 |
49.713 |
12.499 |
.000 |
|
Within Groups |
318.202 |
80 |
3.978 |
|
|
|
|
Total |
765.622 |
89 |
|
|
|
|
|
Air Temperature |
Between Groups |
320.287 |
9 |
35.587 |
16.040 |
.000 |
|
Within Groups |
177.489 |
80 |
2.219 |
|
|
|
|
Total |
497.776 |
89 |
|
|
|
|
|
Soil Temperature |
Between Groups |
335.993 |
9 |
37.333 |
13.986 |
.000 |
|
Within Groups |
213.547 |
80 |
2.669 |
|
|
|
|
Total |
549.540 |
89 |
|
|
|
|
Table 8: ANOVA Result for School Farm |
||||||
|
|
Sum of Squares |
df |
Mean Square |
F |
Sig. |
|
|
Surface Temperature |
Between Groups |
244.704 |
9 |
27.189 |
2.969 |
.004 |
|
Within Groups |
732.742 |
80 |
9.159 |
|
|
|
|
Total |
977.446 |
89 |
|
|
|
|
|
Air Temperature |
Between Groups |
171.451 |
9 |
19.050 |
25.930 |
.000 |
|
Within Groups |
58.773 |
80 |
.735 |
|
|
|
|
Total |
230.225 |
89 |
|
|
|
|
|
Soil Temperature |
Between Groups |
541.122 |
9 |
60.125 |
40.533 |
.000 |
|
Within Groups |
118.667 |
80 |
1.483 |
|
|
|
|
Total |
659.789 |
89 |
|
|
|
|
Table 9: ANOVA Result for Cemented Floor |
||||||
|
|
Sum of Squares |
df |
Mean Square |
F |
Sig. |
|
|
Surface Temperature |
Between Groups |
563.496 |
9 |
62.611 |
31.646 |
.000 |
|
Within Groups |
158.280 |
80 |
1.979 |
|
|
|
|
Total |
721.776 |
89 |
|
|
|
|
|
Air Temperature |
Between Groups |
253.031 |
9 |
28.115 |
27.101 |
.000 |
|
Within Groups |
82.991 |
80 |
1.037 |
|
|
|
|
Total |
336.022 |
89 |
|
|
|
Figure 15 presents the Print screen of GLOBE Visualization page of St. Peter’s Unity secondary School, Akure, Ondo State, Nigeria.
|
Discussion
- Does urbanization increases surface temperature?
- Does surface temperature have corresponding influence on air temperature increase?
- Does surface temperature have corresponding influence on soil temperature at a depth of 10 cm?
From Figure 12, increases in surface temperature and air temperature with increase in soil temperature are observed after week 14.
From Figure 13, after twelve weeks, the surface temperature, air temperature and soil temperature experienced increase in their values.
From Figure 14, after twelve weeks, the surface temperature and air temperature experienced increases in their values.
ANOVA statistical technique was used to test the significance of surface temperature across the sites in area of investigation as well as the significance of the corresponding influence of the surface temperature on air temperature and soil temperature.
Table 7 shows the ANOVA result from the School Field site. The value of the F-statistics for surface temperature, air temperature and soil temperature at a depth of 10 cm, at probability p< 0.05 and 5% error level are 12.499, 16.040 and 13.986 respectively. All the three variables have significant values of 0.000. This indicates that surface temperature, air temperature and soil temperature at a depth of 10 cm over the School Field is significant across the study area. This implies that the significance of one is a corresponding significance of the other over the area of investigation.
Table 8 presents the ANOVA result from the School Farm observation site. The F-statistics values for surface temperature, air temperature and soil temperature at a depth of 10 cm, at probability p< 0.05 and 5% error level are 2.969, 25.930 and 40.533 respectively. The significant values of the surface temperature, air temperature and soil temperature at a depth of 10 cm are 0.004, 0.000 and 0.000 respectively. This indicates that surface temperature, air temperature and soil temperature at a depth of 10 cm over the School Farm site is significant across the study area.
Table 9 displays the ANOVA result from the Cemented Floor atmospheric site. In this case, the soil temperature at a depth of 10 cm was not carried out. Hence, two variables are possible. The F-statistics values for surface temperature and air temperature, at probability p<0.05 and 5% error level are 31.646 and 27.101 respectively. The significant values of the surface temperature and air temperature are 0.000 and 0.000 respectively. It reveals that the surface temperature and air temperature over the cemented floor is significant across the study area.
Conclusion
The study has revealed that the rate of urbanization is high in the Akure city and this consequently impacted the study area over the period of investigation; and that there is significant influence of urbanization on surface temperature. In addition, surface temperature has a close relationship with air temperature and soil temperature such that there is greater influence of surface temperature on air temperature and soil temperature.
It is recommended the future study on effect of urbanization rate in the area of study should include more climatic factors for a more broad based understanding.
Additional Information
Urban population worldwide has grown rapidly from 751 million in 1950 to 4.2 billion in 2018. Asia, despite its relatively lower level of urbanization, is home to 54% of the world’s urban population, followed by Europe and Africa with 13% each. Today, the most urbanized regions, with percentage of population living in urban areas, include:
- Northern America: 82%
- Latin America and the Caribbean: 81%
- Europe: 74%
- Oceania: 68%
*Measurements from 2018
The level of urbanization in Asia is now close to 50%. In contrast, Africa remains mostly rural, with 43% of its population living in urban areas. Overall, 55% of the world’s population lives in urban areas, a proportion that is expected to increase to 68% by 2050.
Given these increases in urbanization, it's important to ensure that the natural ecosystems in our cities are in good condition. To support this effort, you can take action by examining the state of the environment in the city where you live and try to identify the parameters that influence the quality of life for city dwellers. You can also help raise awareness of urban ecosystem problems by reporting your findings to our databases and other environmental authorities to better understand how the urban habitat affects the various Earth spheres.
Acknowledgments
Compiled by:
- Prof. Constantinos Cartalis
- Dr. Dixon Butler
Many thanks to the members of the Science Working Group for their comments.
References
- European Environment Agency (EEA): https://www.eea.europa.eu/themes/sustainability-transitions/urban-environment
- GLOBE: https://www.globe.gov/
- IPCC: https://www.ipcc.ch/report/ar5/wg2/urban-areas/