Findings - Ireland

GLOBE Ireland Air Quality Campaign 2021/22
The GLOBE Ireland Air Quality Campaign is a citizen science project to measure and assess nitrogen dioxide (NO2) air pollution at schools in Ireland. This is an educational project designed to raise awareness about traffic-related air pollution and showcase the potential of citizen science to gather unique datasets and insights into our environment. There have been 7 Air Quality campaigns since 2019, overall participation in the campaigns has increased year-on-year, from 31 schools taking part in the inaugural campaign in February 2019, to 154 schools in March 2022.
There were over 300 school groups participating in the Air Quality campaign this 2020/21 academic year, some schools took part in more than one campaign. 152 school groups took part in the October 2021 campaign and 154 schools groups participated in the April 2022 campaign
All twenty-six counties of Ireland were represented by participating schools in this academic year, an increase from previous campaigns and highlighting the level of interest in air pollution at a national level.
The campaign focuses on the measurement of nitrogen dioxide (NO2) outdoors at three locations on school grounds. A total of 663 valid NO2 (µg/m3) measurements were recorded for the combined October 2021 and March 2022 Air Quality campaigns.
GLOBE Ireland was delighted to collaborate with GLOBE Malta (October campaign) and GLOBE France (March campaign) this year. This brought a whole new dimension to the Air Quality campaign. We look forward to future collaborations with GLOBE
Schools enaged with the topics of air pollution, weather, mapping and created inspiring projects (posters, artwork, blog posts) which they shared with GLOBE Ireland and their school community. It is wonderful to see the students progress from scientific observations to action-based iniatives to support the environment. Well done to the all the schools who partpicated!

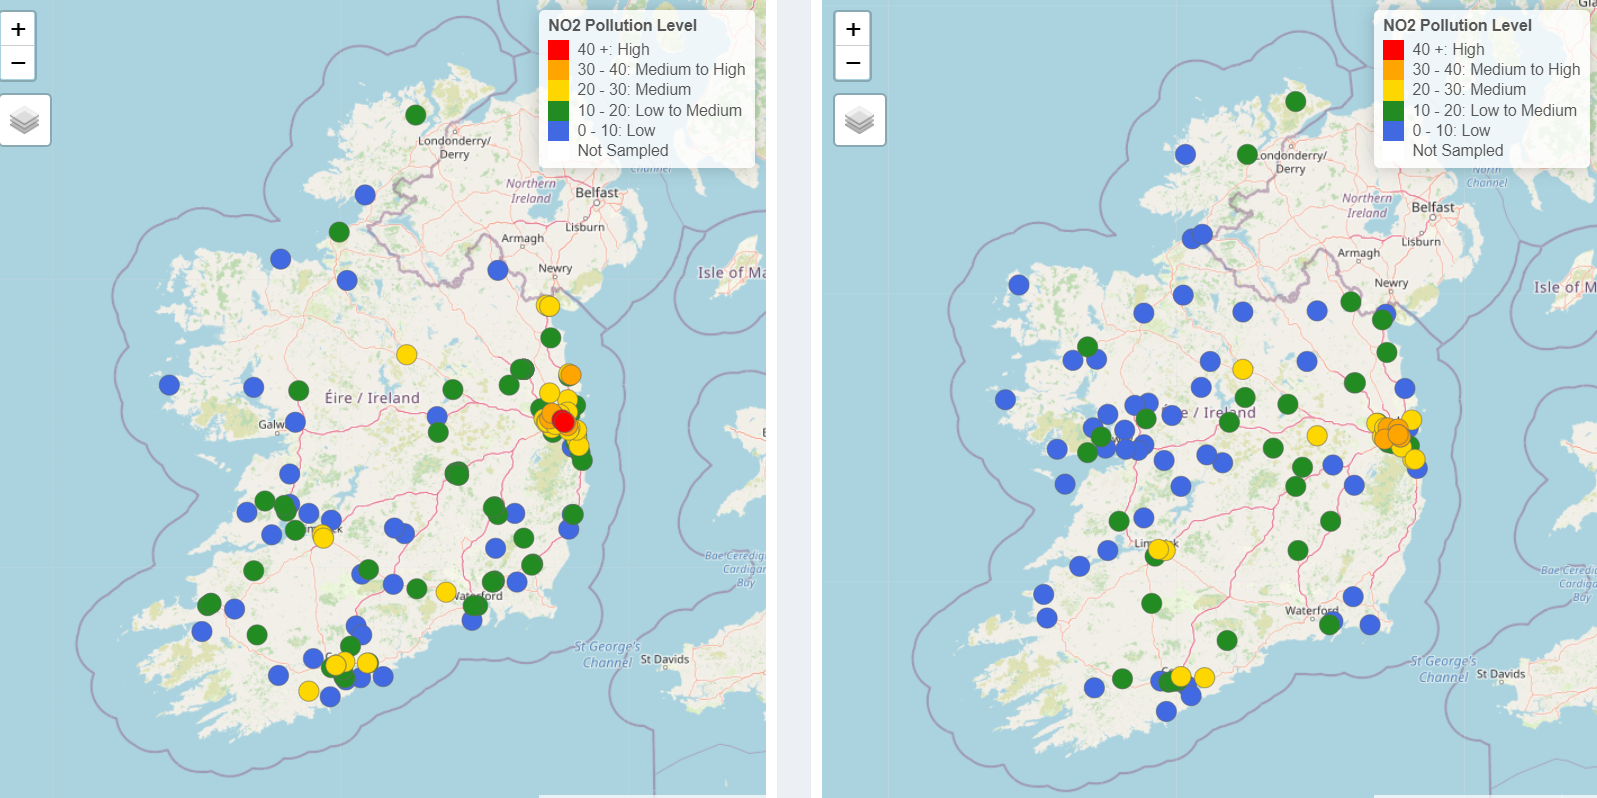
84% of NO2 measurements during 2021/22 fall into the two lowest pollutant level categories (low and low to medium), which is between 0 and 20µg/m3. Conversely, 14% of NO2 measurements are between 20µg/m3 and 30µg/m3 indicating elevated pollutant levels for a number of schools and less than 2% measure > 30µg/m3 . Only two measurements exceeded the EU annual guideline value of 40µg/m3, both tubes greater than 40µg/m3 were located close to roads in the Greater Dublin area.

Figure 2. Average maximum NO2 measurements recorded at schools categorized by population profile. Source from EPA Analytics Team 2022 https://analyticsepa.shinyapps.io/GlobeMar22/
The graph in Figure 2 shows the average of the maximum NO2 values measured at each school, characterized by location profile (city, suburb, town, rural) during two Air Quality campaigns. The maximum values are typically from tubes located closest to a ‘main road’. In general, schools located in cities and suburbs of cities recorded higher NO2 pollutant levels compared to schools located in small towns and rural settings.
Air Quality Campaign 2021/22 Conclusions
It is important to note that the measurements were taken over a short period (4 weeks during October 2021, and April 2022) and represent an average level during this short period.
The results of the 2021/22 Air Quality campaigns show that, for most schools during the measurement period, there are generally low and low to medium levels of NO2 pollution in the air surrounding schools.
There is a consistent trend of deteriorating air quality in schools located in urban centers, especially in the Greater Dublin area. Occasional higher NO2 pollution levels can occur in schools outside of these urban areas where a school is located near highly trafficked areas. The Air Quality campaign results suggest that students and staff of city, and some suburban schools, are exposed to elevated NO2 concentrations, particularly in parts of the school grounds adjacent to main roads. This is consistent with EPA findings of higher nitrogen dioxide levels recorded in urban environments, where traffic-related air pollution is elevated. It is evident that further investigation is needed to understand the magnitude of this threat.
Teachers and Students did excellent further research to understand the variability of NO2 levels due to: street architecture (ventilation); local topography; prevailing wind; and changes in weather from one recording period to the next.
Students submitted their Air Quality work as reports and research posters. You can click on a poster below to see its content. Each project takes a different perspective on the results and offers unique solutions to improve local air quality.
Research Posters


