GLOBAL News - NASA Goddard Space Flight Center
March Urban Heat Island Intensive Observation Period Summary

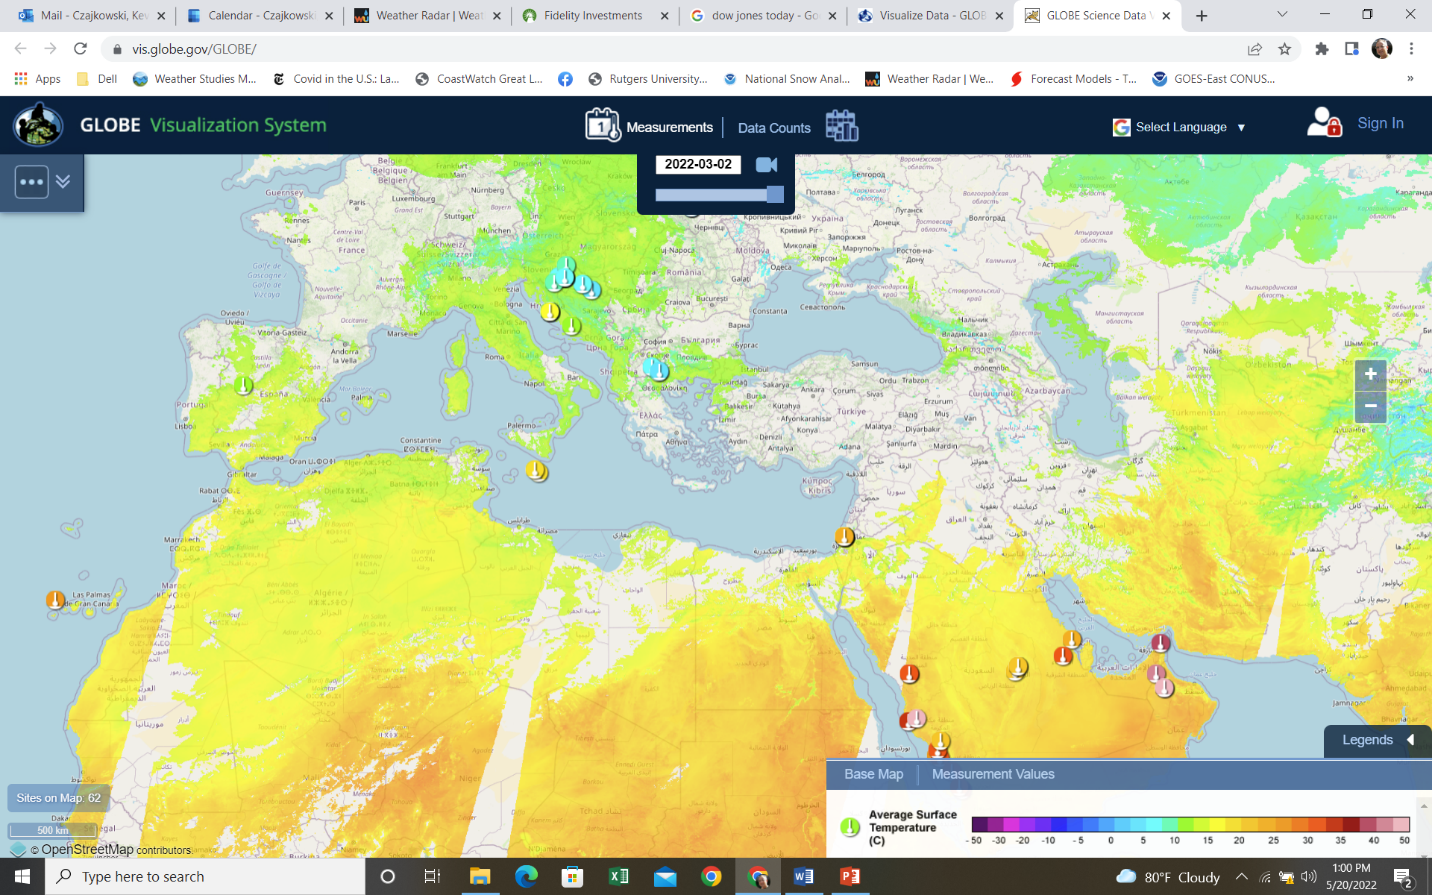
Map of Europe, Northern Africa and the Middle East showing how the temperature varies across the region on 02 March 2022. The GLOBE observations are overlaid onto land surface temperature from the MODIS satellite sensor. This can be done with the GLOBE Visualization page. On the GLOBE webpage (http://globe.gov), go under GLOBE Data and Visualize Data. Then, click on the blue bar that says Enter the Visualization System.
GLOBE completed another great month of the Urban Heat Island (UHI) Intensive Observation Period (IOP) in March 2022. In all, 107 schools participated, and 1,699 observations were contributed throughout the month.
“It is great to see more and more schools becoming active in this very important project. UHI is becoming more and more important around the world,” Dr. Kevin Czajkowski (“Dr. C” from the University of Toledo, Ohio) said in a recent GLOBE Community Blog.
“Saudi Arabia, Croatia, Greece, and Taiwan had many schools take observations during March. I am so grateful for the participation of all of the students and teachers and the great work they have done. I would really like to encourage all of the teachers to have their students take surface temperature observations of more than one cover type. Have the students compare the surface temperature and air temperature above a grassy or vegetated surface as well as a built surface like asphalt or cement. The students will see how different materials have different temperatures.”
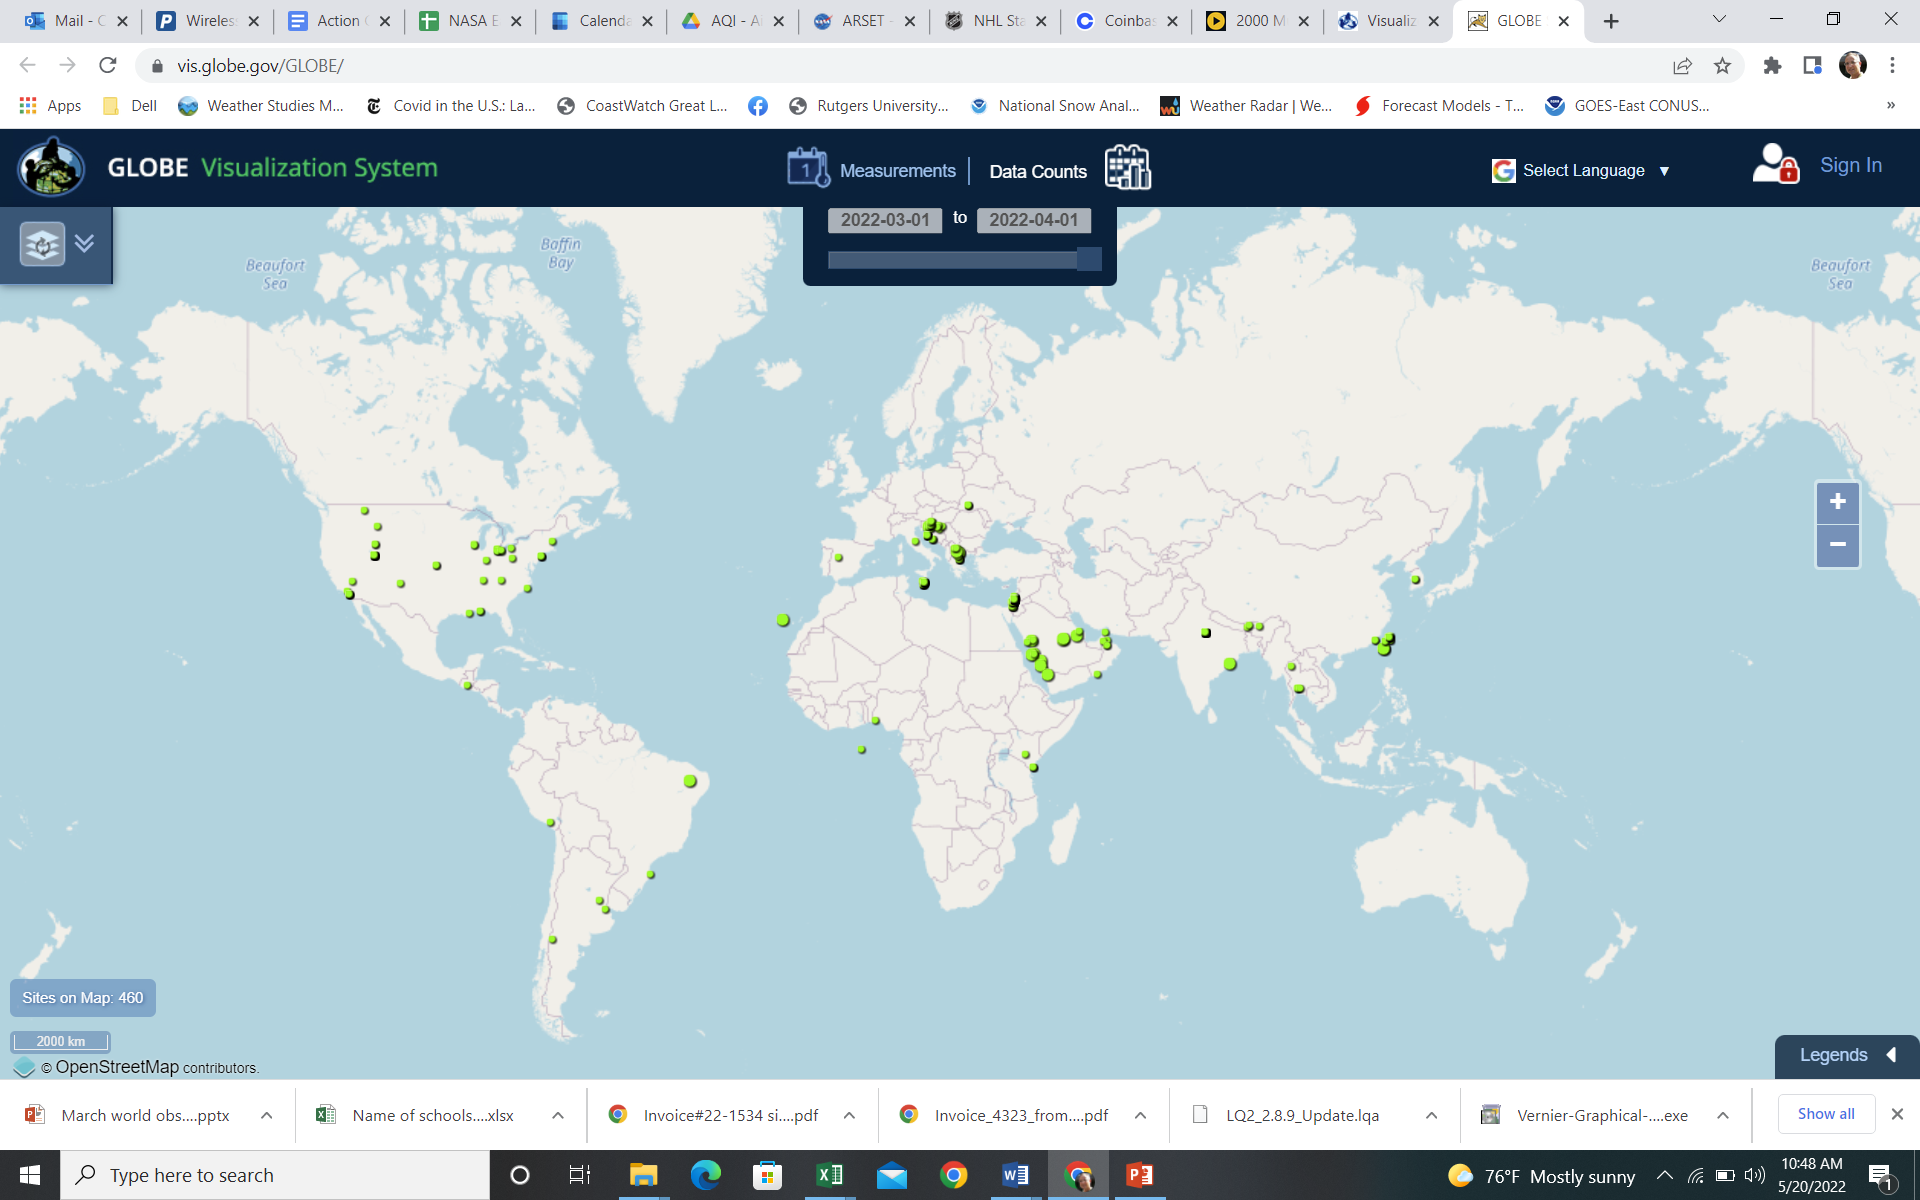
“As you can see in the map below of the schools that took surface temperature observations during March, there is quite a wide spread of observations across the world.”

For more details on the IOP, including the schools that participated and the number of observations taken, click here
News origin: GLOBE Implementation Office


