Appleman Chart Student - Clouds Protocol
Predicting Contrails Using an Appleman Chart [Student]
Background: Military planners have been interested in condensation trail (contrail) forecasts since World War II. Contrails can make any aircraft easy to locate by enemy forces, and no amount of modern stealth technology can hide an aircraft if it leaves a persistent contrail in its wake. In 1953, a scientist named H. Appleman published a chart that can be used to determine when a jet airplane would or would not produce a contrail. For many years, the US Air Force Global Weather Center used a similar chart to make contrail forecasts.
The first published reports of contrail formation appeared shortly after World War I. At first, scientists were not sure how contrails formed. We now know that they are a type of mixing cloud, similar to the cloud that sometimes forms from your breath during a cold winter day. Appleman showed that when the air outside of the airplane is cold enough and moist enough, the mixture of the jet exhaust and the air would form a cloud.
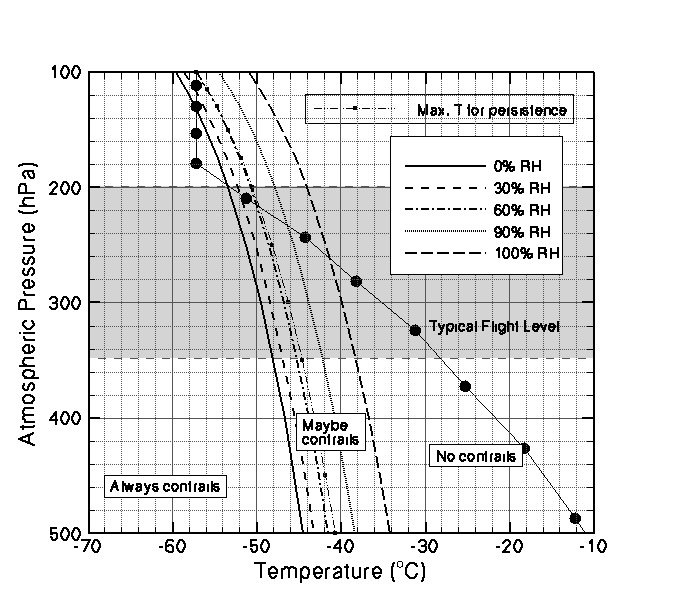
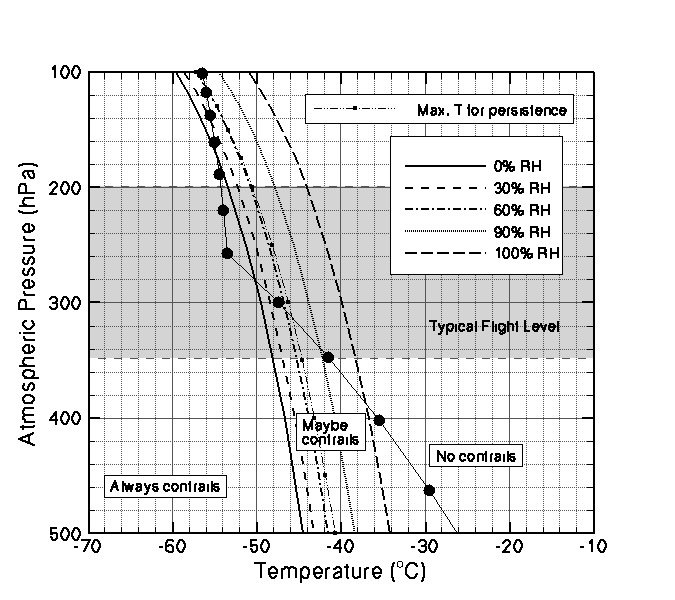
An example of a contrail-forecasting chart is shown below. We will use the chart to make our own forecasts, and make observations to determine whether they are true or false.
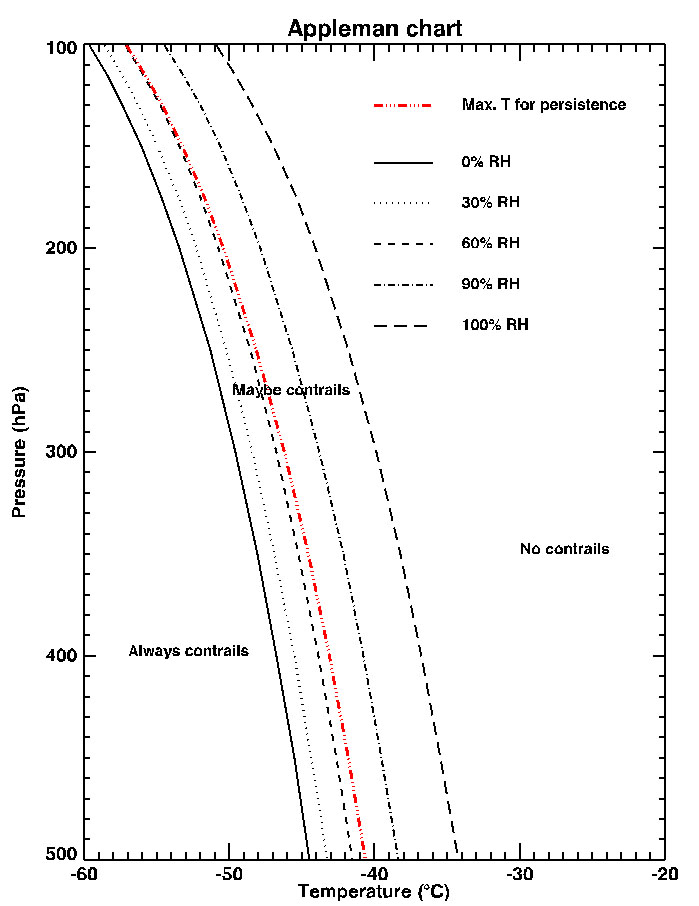
How to use the Appleman chart:
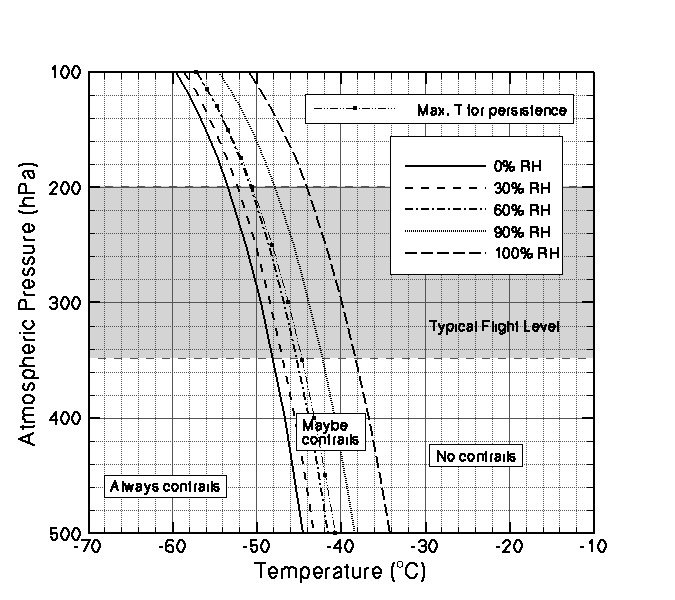
A. Plotting the graph: Using either the temperature information provided by the teacher or the temperatures obtained from an Internet location (see note below), complete the table on the "Student Data Sheet", then plot the temperatures corresponding to each pressure level on the "Appleman Chart: Student Graph Worksheet". Connect the points to create a temperature profile of the atmosphere.
Note: Temperature and humidity information can be obtained from weather balloon soundings launched twice a day from several locations around the country. Several locations on the Internet including http://weather.uwyo.edu/upperair/sounding.html provide detailed sounding information. Choose the location nearest your school.
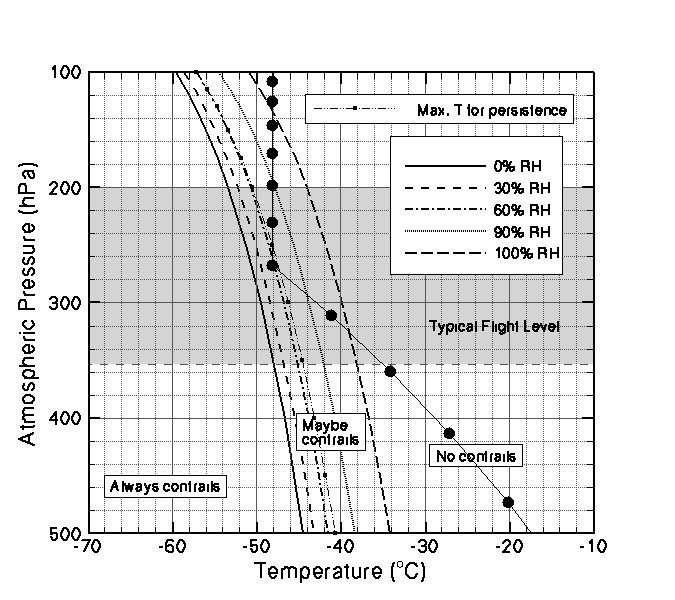
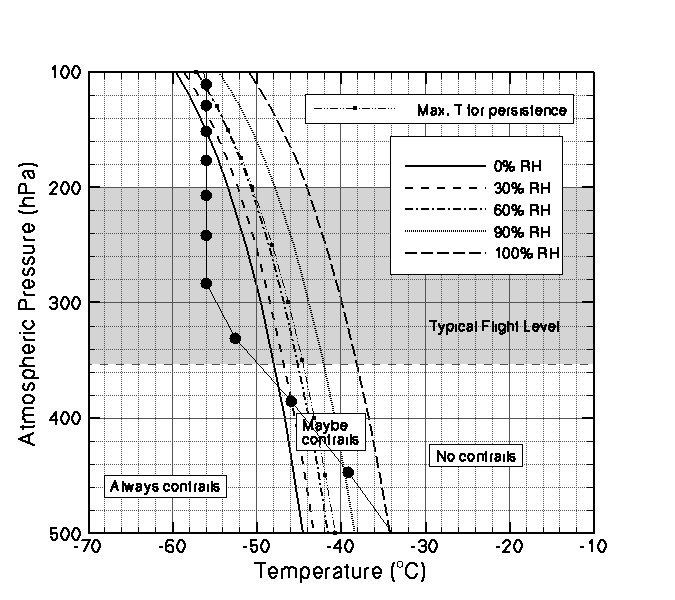
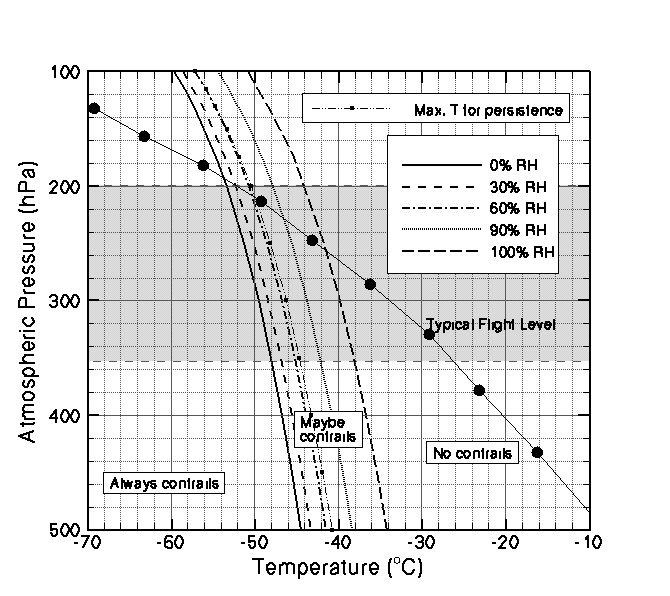
B. Using the graph: The two most important lines on the chart are the 0 percent relative humidity line and the 100 percent relative humidity line. If the atmosphere is colder than the temperature indicated by the 0% line, a contrail would form even if the relative humidity of the atmosphere were zero. By itself, the airplane will supply enough moisture to make the contrail, and no moisture is necessary from the atmosphere to form the cloud. According to the chart, contrails will always form when the temperature profile is to the left of the 0% line. If the atmosphere were warmer than the temperature indicated by the 100% line, a contrail could not form even if the relative humidity of the atmosphere were 100 percent. The combined moisture from the jet exhaust and the atmosphere will never be enough for the mixture to produce a cloud. Temperature profiles to the right of the 100% line will never form a contrail. For temperatures between the 0% and 100% lines, the possibility of a contrail forming will depend on the atmospheric moisture, represented on the chart as relative humidity. A contrail may or may not form when the temperature is between the 0% and 100% lines.
Q1: Look at the temperature profile on your chart. Is it possible for a contrail to form over your area today?
Q2: If it is possible for a contrail to form, at what level must the airplanes fly to make a contrail?
Q3: Why might a contrail form on a day when no contrails are forecasted to form?
Q4: Why might no contrails form on a day when contrails are forecasted to always form?
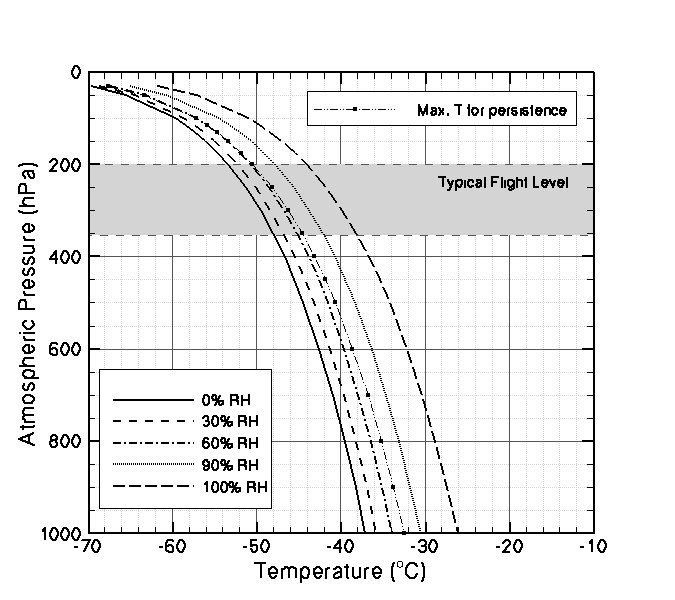
For the next two questions, see "Appleman Chart Extended to Earth's Surface."
Q5: Why don't airplanes make contrails when they are flying low (shortly after takeoff or before landing)?
Q6: Can you think of a place where low-flying jet airplanes could produce a contrail?
Q7: Most commercial jets fly between 8 and 12 km (26,000 and 39,000 feet, or roughly 350 hPa to 200 hPa). Suppose that all aircraft on trips across the country were required to fly at or above 11 km (36,000 feet or roughly 230 hPa). Do you think the number of contrails would increase or decrease?
Q8: Suppose that all aircraft were required to fly at or below 9 km (29,000 feet or roughly 310 hPa). Do you think the number of contrails would increase or decrease?
Humidity: Both the temperature and humidity of the atmosphere help to determine whether a contrail can form. As the relative humidity in the atmosphere increases, the atmosphere is able to supply more moisture into the jet aircraft exhaust plume, and a contrail is more likely to form. The temperature of the atmosphere does not have to be as cold to form contrails at 60% relative humidity compared to 0% relative humidity. If the relative humidity of the atmosphere were 60 percent, then a contrail can form if the atmospheric temperature is less than the temperature indicated by the 60% line (temperature profile is to the left of the 60% line).
Calculating Contrail Prediction Accuracy
Collect sounding data and corresponding contrail observations for at least 10 days. Record your observations on the "Student Data Sheet" as before.
Use the information from your Student Data Sheets to complete the following questions:
Q9: How many times were contrails predicted, and they did occur? (Let us call this number A).
Q10: How many times were contrails predicted, and they did not occur? (Let us call this number B).
Q11: How many times were contrails not predicted, but they did occur? (Let us call this number C).
Q12: How many times were contrail not predicted, and they did not occur? (Let us call this number D).
The percentage of correct forecasts is (A + D)/(A + B + C + D).Q13: What percentage of correct forecasts did you get at your school?
The US Air Force conducted studies to test the accuracy of the Appleman chart. Military pilots sometimes remark in their flight reports whether or not contrails form during their flights. Using these reports and observations of temperature, pressure and relative humidity, the USAF found that the forecasts using the Appleman method were correct about 60 to 80 percent of the time. Looking more closely at the data, they found that when no contrails were forecast, the forecast was correct 98 percent of the time! However, when contrails were forecast to occur, the forecast was correct only 25 to 35 percent of the time, and often failed to predict the occurrence of contrails. Thus, the Appleman chart tends to under predict the occurrence of contrails and to over predict the non-occurrence of contrails. For this reason, the USAF is actively investigating better ways to compute contrail formation.
Q14: How do your results compare to what the US Air Force found?
Persistent contrails:
Some contrails are short, and last for only a few seconds. Other contrails are very long, and continue to grow long after the jet airplane has passed. Why do some contrails remain in the sky so long? Let's go back to the example of the cloud forming on your breath during the winter. Such clouds usually disappear as soon as you take your next breath. The relative humidity of the winter air at the surface is usually well below 100%, and cannot sustain a mixing cloud for a long time. The relative humidity at the altitudes where airplanes fly can sometimes be as high as 90%. Surprisingly, at cold temperatures ice clouds (including contrails) can form and persist at humidities lower than 100%. The red line (dash-double dot line) in the Appleman chart shows at what humidities contrails can persist (usually between 60% and 70% relative humidity). Thus, if the air is moist enough, and colder than (temperature profile is to the left of the red line), then the Appleman chart indicates that persistent contrails can form.
Extension Activity: Use the humidity data to forecast whether persistent contrails can form.
Student Data Sheet: Soundings and Contrail Observations
Soundings DataDate __________
Source of data (website): __________________________________________________
| Atmospheric Pressure (hPa) | Temperature (Co) | Relative Humidity (%) | Altitude (m) |
Contrail Observation Data
Are contrails present? ____Yes ____No
If completing the Extension Activity, also make the following observations of any observed contrails:
Number of short-lived contrails _______
Number of persistent non-spreading contrails _______
Number of persistent spreading contrails _______
Appleman Chart: Student Graph Worksheet
Appleman Chart Extended to Earth's Surface
Temperature Profile: Mid-Latitude Winter
Temperature Profile: Sub-Arctic Summer
Temperature Profile: Sub-Arctic Winter
Temperature Profile: Tropical
Temperature Profile: Mid-Latitude Summer
