How to Read a CALIPSO Satellite Match - Clouds Protocol
About CALIPSO

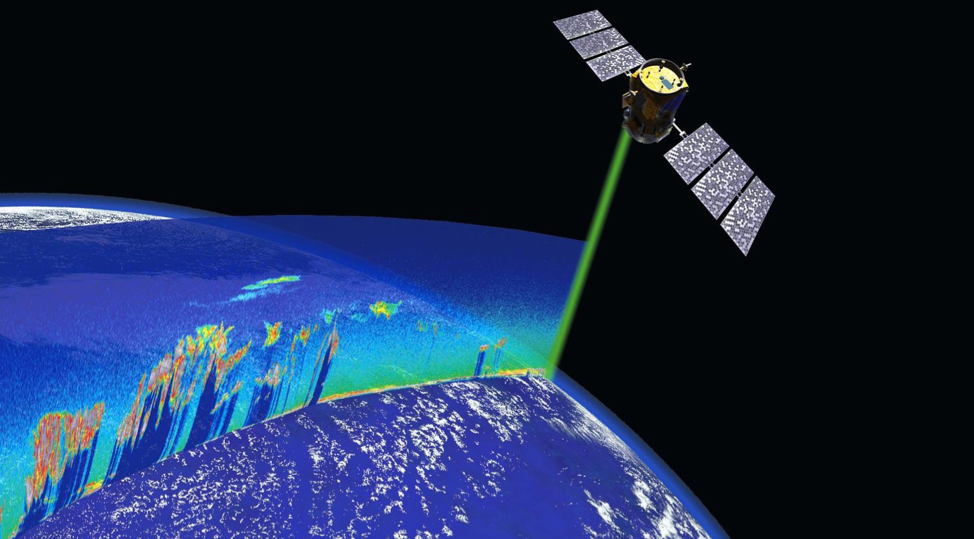
CALIPSO, or Cloud-Aerosol Lidar and Infrared Pathfinder Satellite Observations, is a mission aimed to help better understand aerosols and clouds. CALIPSO uses LIDAR or Light Detection and Ranging to create vertical profiles of clouds and aerosols by sending pulses of light to Earth’s surface and assessing the amount of light that is reflected back. The information obtained from CALIPSO helps us understand clouds, aerosols, and radiation in relation to climate and weather to ultimately make this world a healthier, better place to live in.
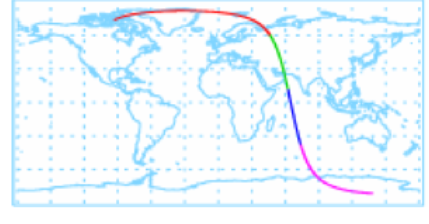
CALIPSO data is collected in orbits, or the path the laser took to collect atmospheric  information. The orbits are then divided into smaller chunks. When you receive a satellite match with CALIPSO, you get an image for the orbit portion that passed over your latitude and longitude. See example below of an orbit. The four different colors are the four portions or smaller chunks the data is divided into. The example used in this document was taken within the green portion of the orbit.
CALIPSO and Satellite Matches
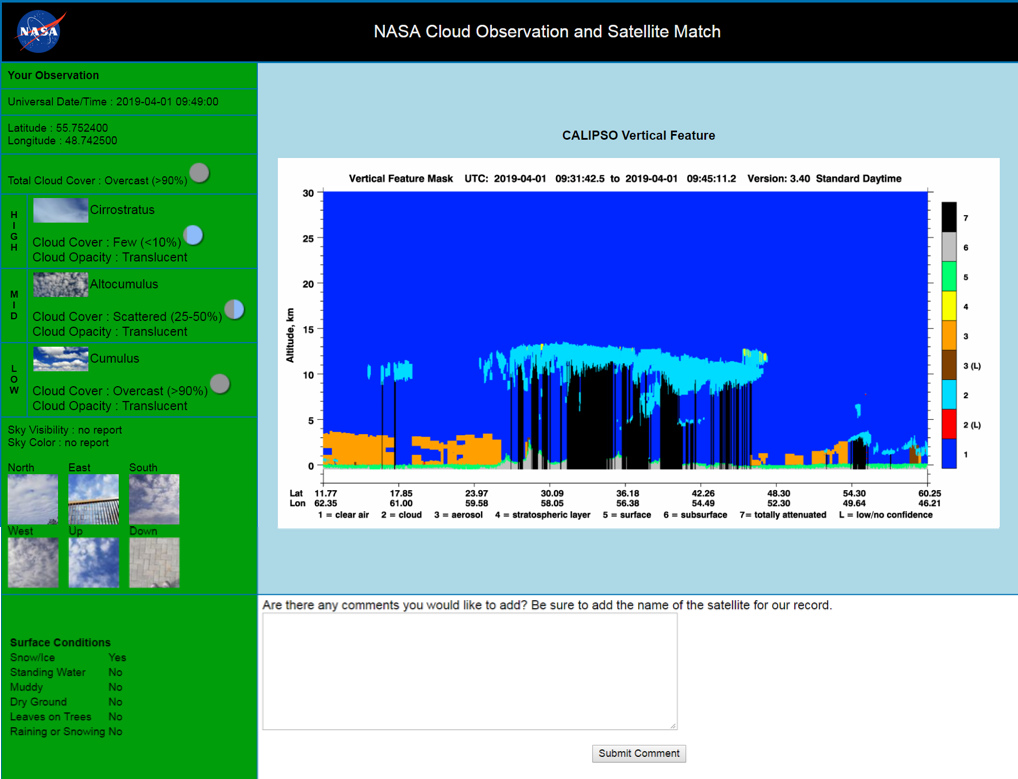
Below is an example of a match table with CALIPSO data. The left-hand side in green are your observations, including any pictures submitted and surface conditions. The right-hand side is the CALIPSO Vertical Feature that matches your location and time.
The vertical feature mask shows the different classifications of things detected in the atmosphere for that day, time, and location. Let’s see how to read the information.

How to Read the CALIPSO Vertical Feature Mask
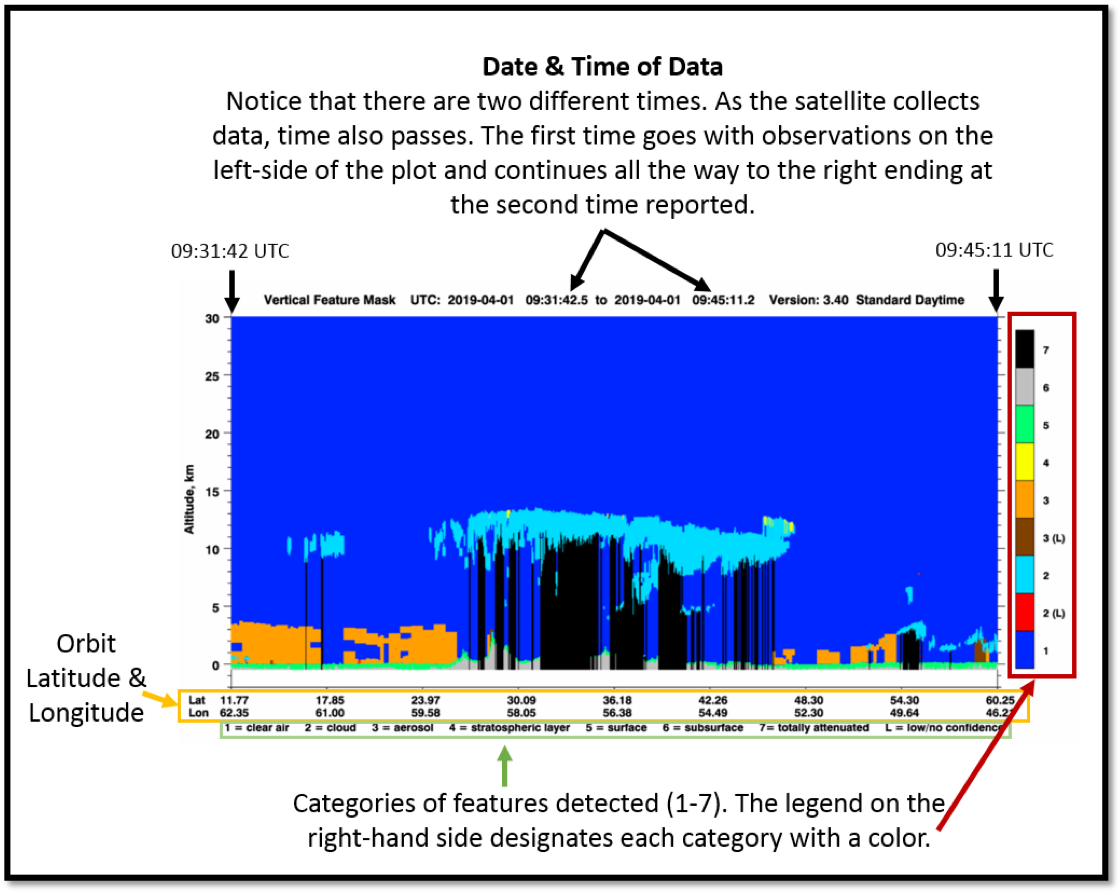
The vertical feature mask shows the different classifications of things detected in the atmosphere for that day, time, and location. Let’s see how to read the information. The vertical feature mask has a lot of information, so let’s break it down into parts.

Follow these steps to find out what CALIPSO detected when you made your cloud observations:
Step 1 – Find your latitude and longitude
Below the plot, you will see “Lat Lon”, which refer to latitude and longitude values, displayed one on top of the other (see yellow-orange box). Remember, your latitude and longitude are on the satellite match table, on the green column. Look through the latitude and longitude values on the CALIPSO plot and make a mark on where your location is as best as possible.
Step 2 – Identify Features Detected
The different colors on the plot show the different features (clouds, aerosols, clear air, etc) detected in the atmosphere. Use the color bar on the right-hand side (red box) to find the category of the feature that was detected near your latitude and longitude. Then find what the feature is by looking at the numbers found at the very bottom, underneath the latitude and longitude values (green box).
Step 3 – Compare
Now that you found the features, see if you were able to see the same thing. Also, see the altitude of the feature. The y-axis in altitude in kilometers. Also note how thick or thin the feature is by using the altitude axis.
|
Altitude range of satellite observation (km) |
GLOBE cloud type |
|
Above 6 |
High clouds (contrails, cirrus, cirrocumulus, or cirrostratus) |
|
2-6 |
Mid level clouds (altostratus or altocumulus) |
|
0-2 |
Low clouds (fog/stratus, stratocumulus, cumulus, nimbostratus, or cumulonimbus) |


