Trees Around the GLOBE Campaign - Join us! - Trees around the GLOBE
Trees Around the GLOBE Student Research Campaign
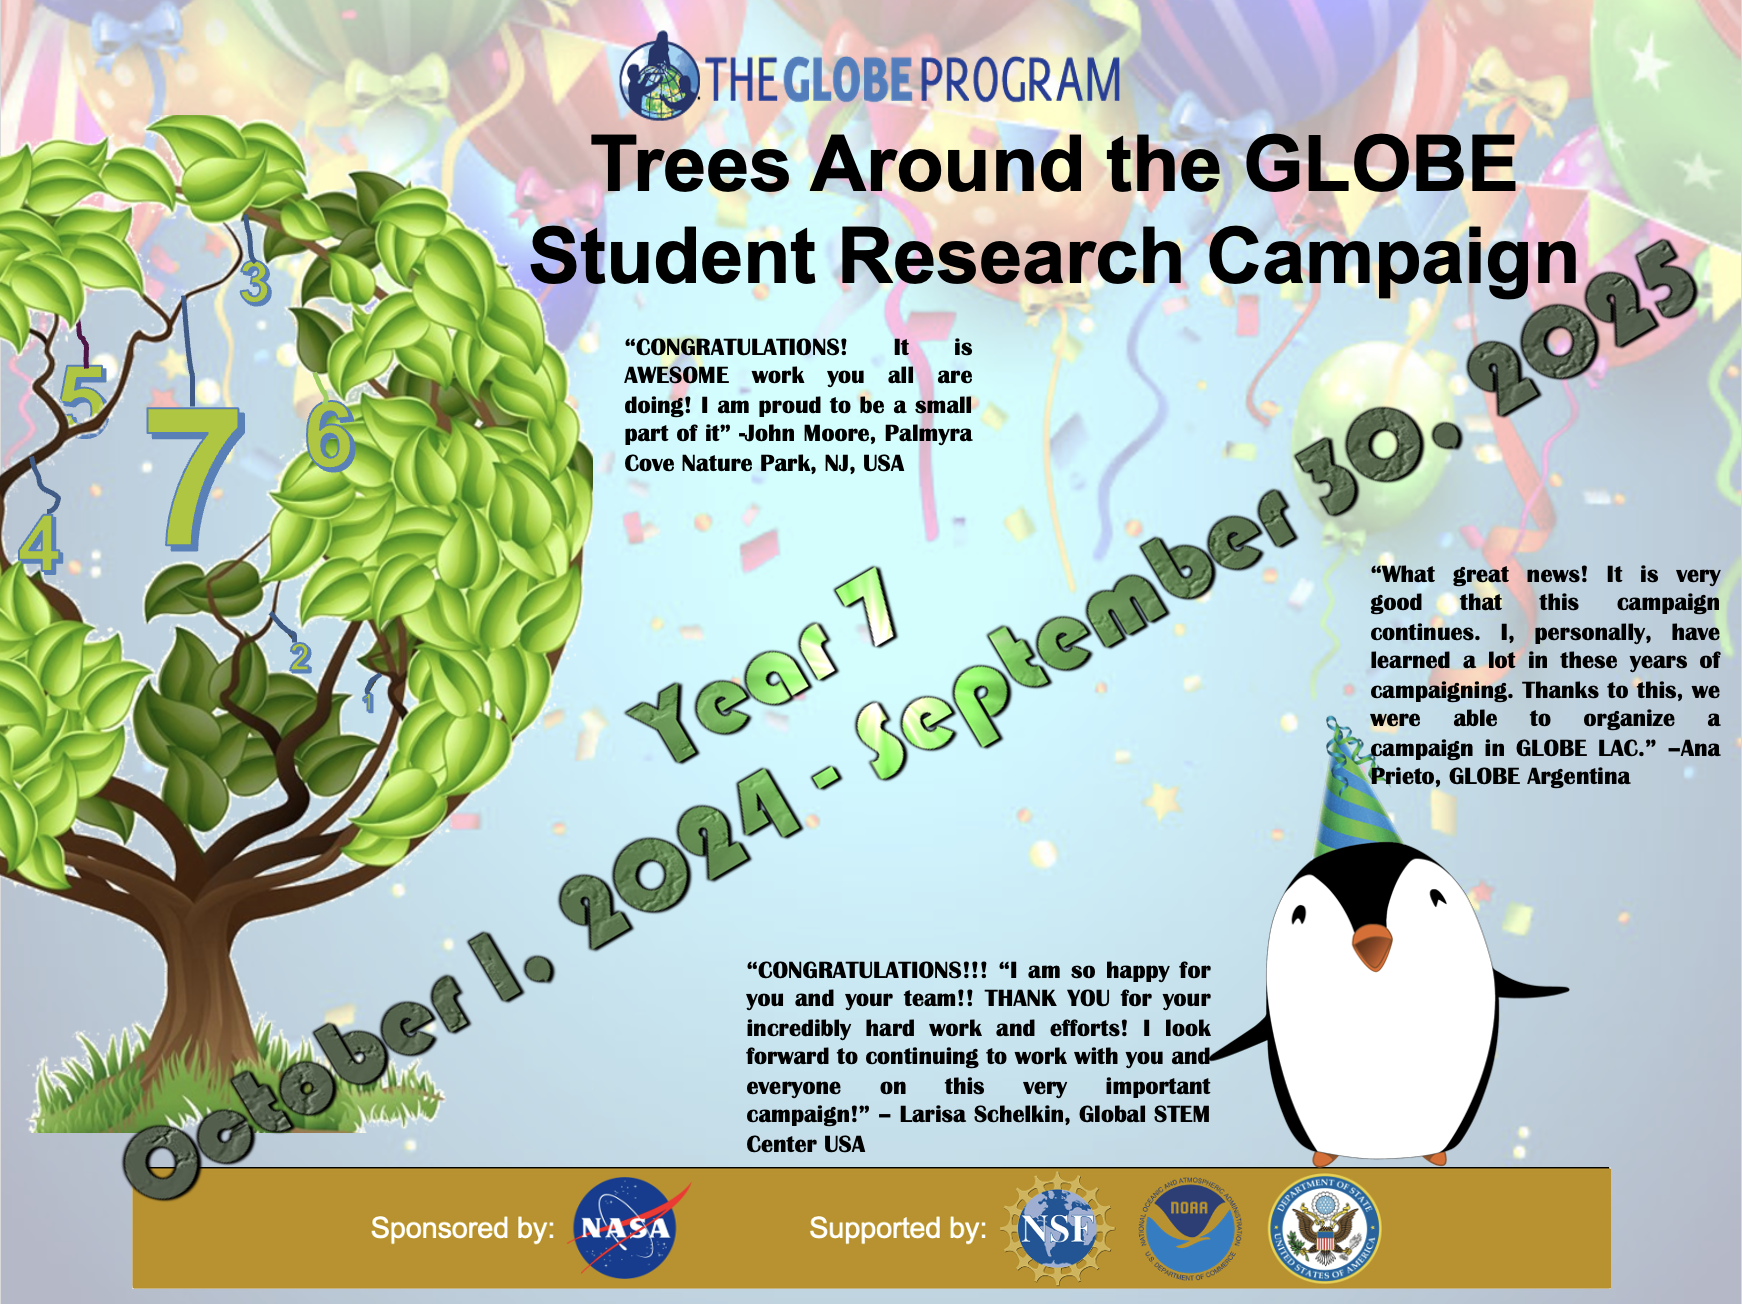
Welcome to Year 7: 1 October 2024–30 September 2025

NASA missions like Landsat, which has been flying for 50+ years, and others in space for up to ten years, these missions focus on looking at change over time, from local to regional to national to global. Looking at change over time is, and will continue to be a major objective of the Trees Around the GLOBE Student Research Campaign and aligns seamlessly to the 2025 GLOBE International Virtual Science Symposium (IVSS) theme of “30 Years of GLOBE: Understanding the Past, Present, and Future.”
For the last six years of the campaign, our campaign team has provided participants, currently from sixty-four countries, the ability to hear, and interact, directly from/with NASA and non-NASA scientists and researchers, review and analyze the newest NASA and GLOBE data, educated on the latest and greatest online data observations and analyst tools, including the GLOBE Visualization System, Open Altimetry, Google Earth Engine, NASA WorldView, My NASA Data, Collect, and many others, depending upon how the students and educators want to analyze, visualize, and understand the ground-based data coming from GLOBE and the space-based data coming from NASA.
Thank you all for being part of the campaign and we are excited for you to join us for Year 7 of the Trees Around the GLOBE Student Research Campaign!

Trees Around the GLOBE Student Research Campaign Active GLOBE Countries for 2025

Breaking Down the Big Questions at NASA: Helping Student Research!
This video is a resource that can be used alongside student research or activities that involve creating and developing research questions. While the video focuses on questions about trees, the basic principles are necessary for asking scientific questions that lead to successful scientific research.
Space-Based Tree Height Observations from Space
The ICESat-2 Mission
The Ice, Cloud, and land Elevation Satellite-2, or ICESat-2, measures the height of a changing Earth, one laser pulse at a time, 10,000 laser pulses a second. Launched September 15, 2018, ICESat-2 carries a photon-counting laser altimeter that allows scientists to measure the elevation of ice sheets, glaciers, sea ice and more - all in unprecedented detail. Our planet's frozen and icy areas, called the cryosphere, are a key focus of NASA's Earth science research. ICESat-2 helps scientists investigate why, and how much, our cryosphere is changing in a warming climate. The satellite also measures heights across Earth's temperate and tropical regions, and takes stock of the vegetation in forests worldwide. With the new dimension, scientists can calculate the amount of vegetation – the trunks, branches, leaves, shrubs and more – that make up an area’s biomass. Studying the gain or loss of biomass can inform calculations of the carbon that forests either take in or release into the atmosphere. The ICESat-2 mission creates a dense grid of measurements across the world, gathering information of the heights of cities, waterways, reservoirs, wetlands, agricultural fields, tundra… the satellite is always on, when it’s operational it will collect a terabyte of data every day.
Learn more about the ICESat-2 Mission at: https://icesat-2.gsfc.nasa.gov/
__________
The GEDI Mission
The Global Ecosystem Dynamics Investigation (GEDI) produces high resolution laser ranging observations of the 3D structure of the Earth. GEDI’s precise measurements of forest canopy height, canopy vertical structure, and surface elevation greatly advance our ability to characterize important carbon and water cycling processes, biodiversity, and habitat. GEDI’s data on surface structure are also of immense value for weather forecasting, forest management, glacier and snowpack monitoring, and the generation of more accurate digital elevation models. GEDI provides the missing piece – 3D structure – in NASA’s observational assets which enables us to better understand how the Earth behaves as a system, and guides the actions we can take to sustain critical resources. The GEDI instrument is a geodetic-class, light detection and ranging (lidar) laser system comprised of 3 lasers that produce 8 parallel tracks of observations. Each laser fires 242 times per second and illuminates a 25 m spot (a footprint) on the surface over which 3D structure is measured. Each footprint is separated by 60 m along track, with an across-track distance of about 600 m between each of the 8 tracks. GEDI expected to produce about 10 billion cloud-free observations during its nominal 24-month mission length.
Learn more about the GEDI Mission at: https://gedi.umd.edu/
__________
Looking at Change Over Time!
The image below is of Lake Mead. Lake Mead is a reservoir formed by the Hoover Dam on the Colorado River in the Southwestern United States. It is located in the states of Nevada and Arizona, 24 miles east of Las Vegas. The largest reservoir in the United States, it supplies water to millions of people across seven states, tribal lands and northern Mexico. It now also provides a stark illustration of climate change and a long-term drought that may be the worst in the U.S. West in 12 centuries.
Looking at this time-series of images of Lake Mead from the NASA/USGS Landsat 7 satellite (2000 image) and NASA/USGS Landsat 8 satellite (2021 and 2022), what has changed? From space, there appear to be some very large-scale changes, but ground observations can see small-scale, local environmental changes. This is why we need students, as part of the Trees Around the GLOBE Student Research Campaign, to take ground-based observations and through analysis, to make sense of these images in the real world.

In September 2017, Hurricane Maria's lashing rain and winds transformed Puerto Rico's lush tropical rainforest landscape. The extensive damage to Puerto Rico's forests had far-reaching effects. Fallen trees that no longer stabilize soil on slopes with their roots, as well as downed branches, can contribute to landslides and debris flows, increased erosion and poor water quality in streams and rivers where sediments build up.
The images below, both 2017 and 2018, are from the Goddard’s Lidar, Hyperspectral and Thermal (G-LiHT) Airborne Imager, a system designed to study the structure and species composition of forests. Shooting 600,000 laser pulses per second, G-LiHT produces a 3D view of the forest structure in high resolution, showing individual trees in high detail from the ground to treetop. In April 2018 (after Hurricane Maria), the team went back and surveyed the same tracks as in 2017 (before Hurricane Maria).
Looking at the picture below of the El Yunque National Forest in Puerto Rico from 2017 compared to 2018, what can be observed about the amount of trees in the forest before and after Hurricane Maria? What can be inferred about the tree heights and land cover before and after the catastrophic event?

One of the major focuses for this campaign is to have students take tree height, land cover, greenings and carbon cycle and use this data to develop research projects that focus on the environment in their local areas. This is in order to understand the larger picture of how our planet is changing over time.
The campaign also focuses on two major online tools for data analysis and comparison of GLOBE data to NASA satellite, airborne and instrument data for land cover and tree height, all in the context of understanding the planet's carbon cycle.
These online tools are:
Global Forest Canopy Height Tool: A 30-meter spatial resolution global forest canopy height map developed through the integration of the Global Ecosystem Dynamics Investigation lidar forest structure measurements and Landsat analysis-ready data time-series.
Global Land Cover Viewer Tool: A way to visualize global land cover change maps and statistics and easily navigate and compare between different areas or years.
Multi-Campaign Collaborations
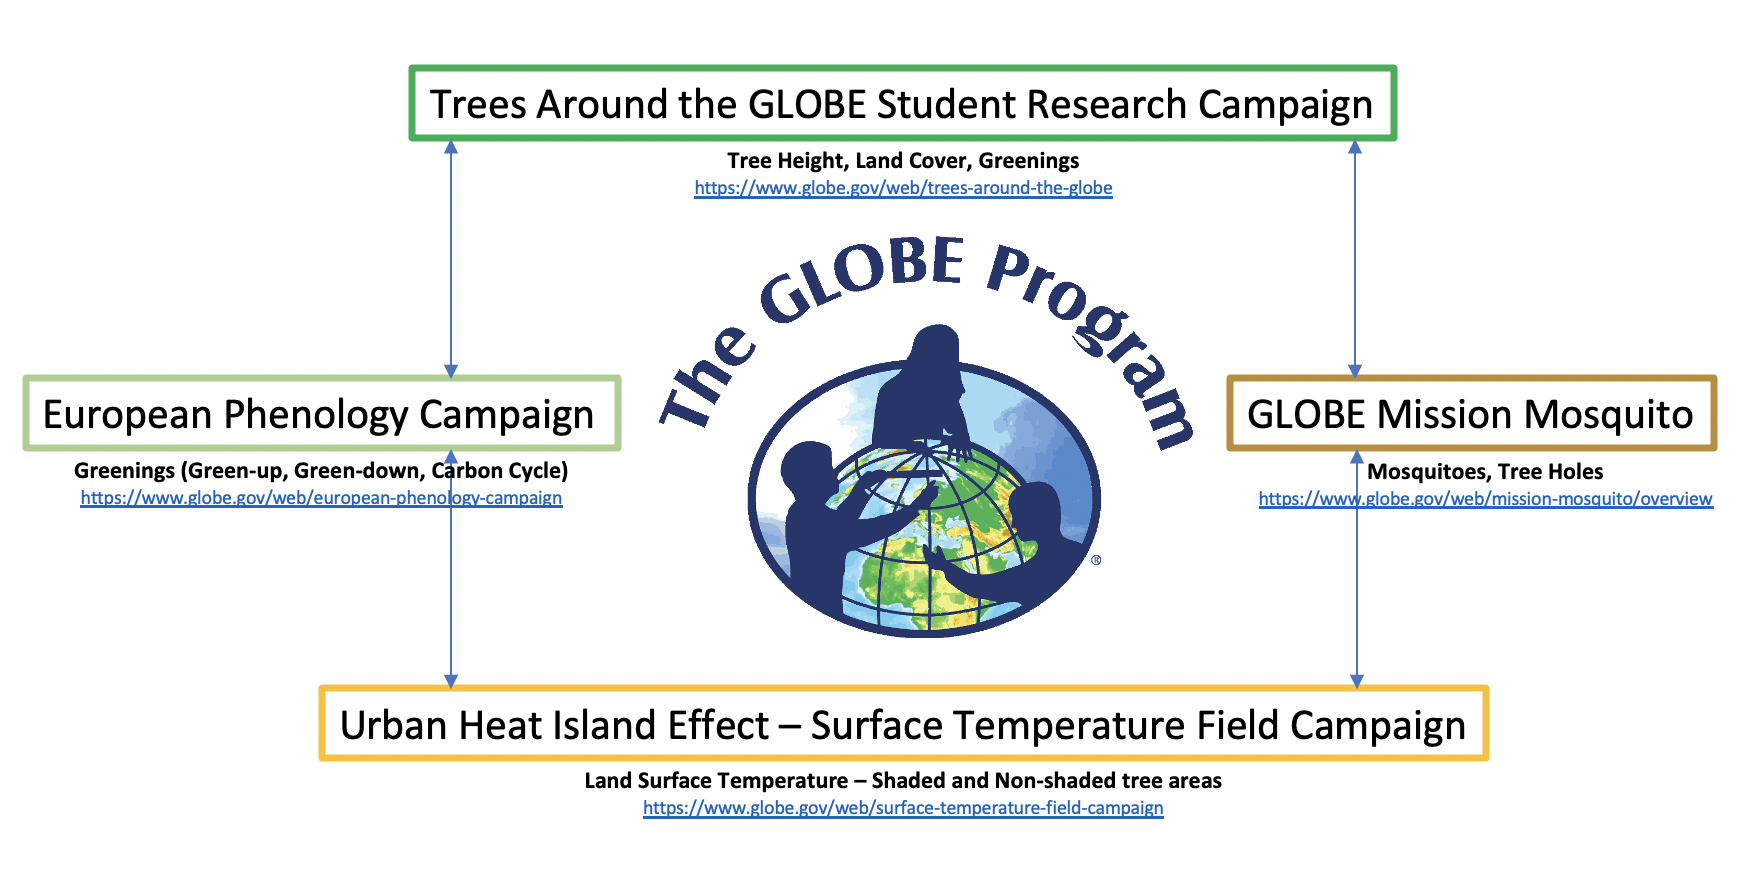
The Trees Around the GLOBE Student Research Campaign is leveraging all the great things many of the other GLOBE campaigns are doing. These campaigns include the European Phenology Campaign (focusing on Green Up, Green Down and identification of trees and vegetation), Urban Heat Island Effect - Surface Temperature Field Campaign (focusing on surface temperatures in urban areas) and GLOBE Mission Mosquito (focusing on mosquito habitats, tree holes and eradicating these potentially dangerous insects carrying vector-borne disease). There are many parallel GLOBE protocol measurements and observations the Trees Around the GLOBE Student Research Campaign will highlight.
When measurements and observations are taken in a specific location, it is vital to know as many environmental variables as possible, so as to better understand the local environment.
For instance, when taking a tree height observation of a tree in a backyard, it is important to know what else is going on around that tree, environmentally. When taking the tree height, observe and take measurements of the land cover, surface temperature, observable mosquito habitats, air temperature, soil moisture and characterization, precipitation and others that you can measure with GLOBE Program protocols.
How can these measurements and observations benefit science and multiple GLOBE campaigns?

European Phenology Campaign
- Campaign website: https://www.globe.gov/web/european-phenology-campaign
- What is GLOBE asking members to observe and measure? Greenings (Green Up and Green Down) and Tree Identification.
- What is GLOBE asking members to do? When taking a tree height measurement or observation, please take Greenings - Green Up or Green Down (depending on the season) and if possible, identify the genus and species of the observed tree. Learn about the Green Up and Green Down Protocols.
- Why is GLOBE asking members to do this? Greenings (Green-Up and Green-Down) measurements help scientists validate satellite estimates of the beginning of the plant growing season in a particular location. By identifying the genus and species of a tree, members can add to the knowledge of global tree distribution.
- *Note: Members do not need to be in Europe to take these observations. The Trees Around the GLOBE Student Research Campaign is all around the globe and members can take these measurements wherever they are.
-

Urban Heat Island Effect Surface Temperature Intensive Observation Period
- Campaign website: https://www.globe.gov/web/surface-temperature-field-campaign
-
What is GLOBE asking members to observe and measure? Urban tree (shaded and non-shaded) surface temperature measurements.
-
What is GLOBE asking members to do? When taking a tree height measurement or observation, take a surface temperature measurement in: 1) the shaded surface under the tree being observed; and 2) the non-shaded area just outside the shaded area of the tree being observed. Learn about the Surface Temperature Protocol.
-
Why is GLOBE asking members to do this? Trees play a big role in keeping towns and cities cool, and the right amount of tree cover can lower summer daytime temperatures in areas shaded by trees.
-

GLOBE Mission Mosquito
- Campaign website: https://www.globe.gov/web/mission-mosquito/overview
-
What is GLOBE asking members to observe and measure? Mosquito habitats and tree holes.
- What is GLOBE asking members to do? When taking a tree height measurement or observation and there is a tree hole (a hole in a tree that can have standing water inside it and be a potential mosquito habitat) in the observed tree, take a Mosquito Habitat Observation. Learn about the Mosquito Habitat Protocol.
- Why is GLOBE asking members to do this? Tree holes can contain stagnant water that could serve as a breeding ground for mosquitoes carrying potentially deadly diseases, such as Zika, dengue and malaria, among others.
-


To join the Trees Around the GLOBE Student Research Campaign, follow these steps:
- Visit the Campaign Community Page, scroll down and click the "Join Community" link above the map.
- For people who are new to GLOBE and have never taken any protocol measurements, complete the e-Trainings for the relevant protocols.
- Start taking Biometry
Tree Height measurements. Some guidelines for choosing trees
to measure:
- Trees measured should be at least 5 feet (1.52 meters) tall.
- Trees measured should be isolated trees or the tallest trees in a large grouping of trees.
- Decide which other Protocols to use to take local environmental measurements.
- Start taking protocol measurements and submit them to GLOBE through the Data Entry Page.
- Connect with GLOBE by attending the campaign webinars and engage in some discussions with other GLOBE schools, scientists, researchers and campaign teams.
- Work with students to develop potential research projects using collected protocol measurement data and data from other GLOBE schools.
- Collaborate with other GLOBE schools from around the world to strengthen the research experience, which could be part of 2025 GLOBE IVSS.
- Begin or contribute to the campaign Discussion Forum.
- Present your measurements and research at a future campaign webinar.
- Just have fun learning all about the planet through GLOBE!
- Download the Tree Height Measurement Tutorial slides
Prepare those clinometers and start measuring Trees Around the GLOBE!
For people who are not already a member of the GLOBE Community, click the Join GLOBE link and follow the registration instructions. Once registered, members will be able to start taking GLOBE protocol measurements.
Campaign History
The Trees Around the GLOBE Student Research Campaign began on 15 September 2018, in conjunction with NASA's ICESat-2 Satellite launch on the same date at 6:02 a.m. PDT. This campaign is a student research campaign focusing on tree height — one of the measurements conducted by the ICESat-2 mission. Tree height is not just a measurement — it is a gateway to understanding many things about the environment. The structure of tree canopies, the 3D arrangement of individual trees, has a huge effect on how ecosystems function and cycle through carbon, water and nutrients.
In order to put the tree height measurements into context, GLOBE recommends students also take measurements of Land Cover Classification, Green Up / Green Down and Carbon Cycle. This will allow for data research comparisons among several GLOBE environmental measurements.
Students are also encouraged to take location baseline protocol measurements of their measurement locations. Some examples are: Air Temperature, Surface Temperature and Soil Temperature.
Check back on this campaign webpage to learn about upcoming webinars, live social media events and blogs related to this campaign!

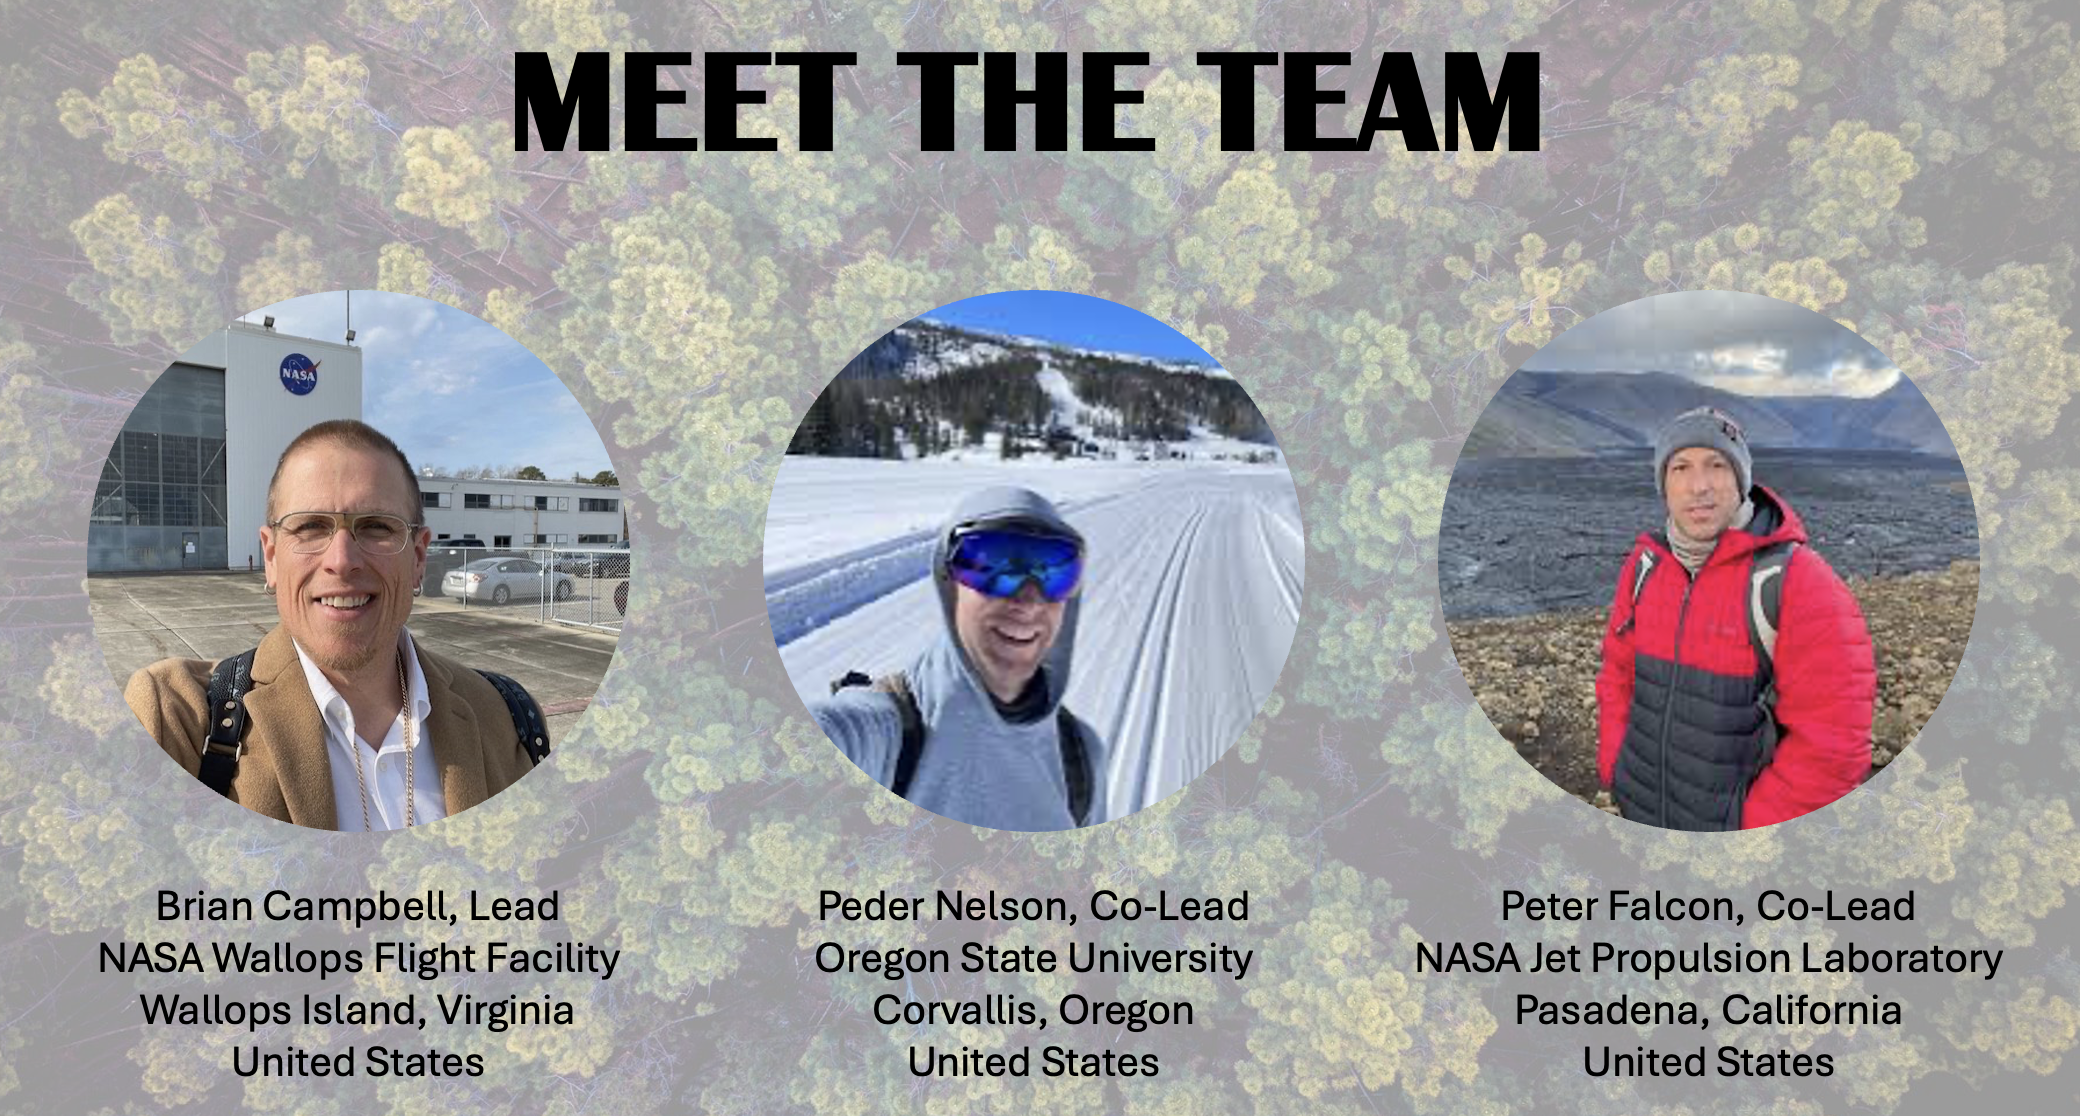
For more information about the Trees Around the GLOBE Student Research Campaign, email the campaign lead, Brian Campbell.


