This is an archived site. The blog entries are for reference only and are not being monitored or managed. The ability to post comments is therefore disabled. Thank you.


Keeping cool in the summer, Part II

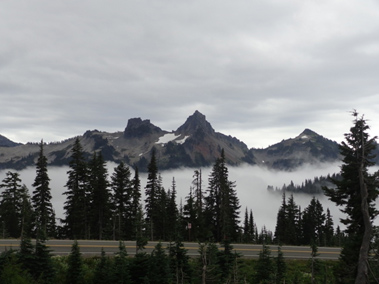
This week we continue last week’s blog on keeping cool in the summer (read Part I at http://globe.gov/explore-science/scientists-blog/archived-posts/sciblog/2013/12/17/keeping-cool-in-the-summer-part-i/), provided by long-time friend of GLOBE, Dr. Peggy LeMone, Chief Scientist for the GLOBE Program from 2003-2009. Dr. LeMone is currently working in the field of weather and cloud formation at the National Center for Atmospheric Research (NCAR).

Peggy Lemone

Dr. Peggy LeMone,
Credit: UCAR

We installed new insulation last year in our roof and outer walls, and installed double-pane windows.  Our impression is that insulating has  kept the summer inside temperatures cooler, especially on the hottest days.   For example, prior to insulating, we recall isolated cases of inside temperatures to 29.4 Degrees Celsius. However,  we do not have enough data to show a clear effect.  I can think of two reasons for this.

First, the weather varies from summer to summer.   Looking at Figure 4 from Part I (see below for your convenience), one sees comparable indoor-outdoor differences for 2010 (before re-insulating) and 2013 (after-re-insulating).

PeggyBlog-Figure4 
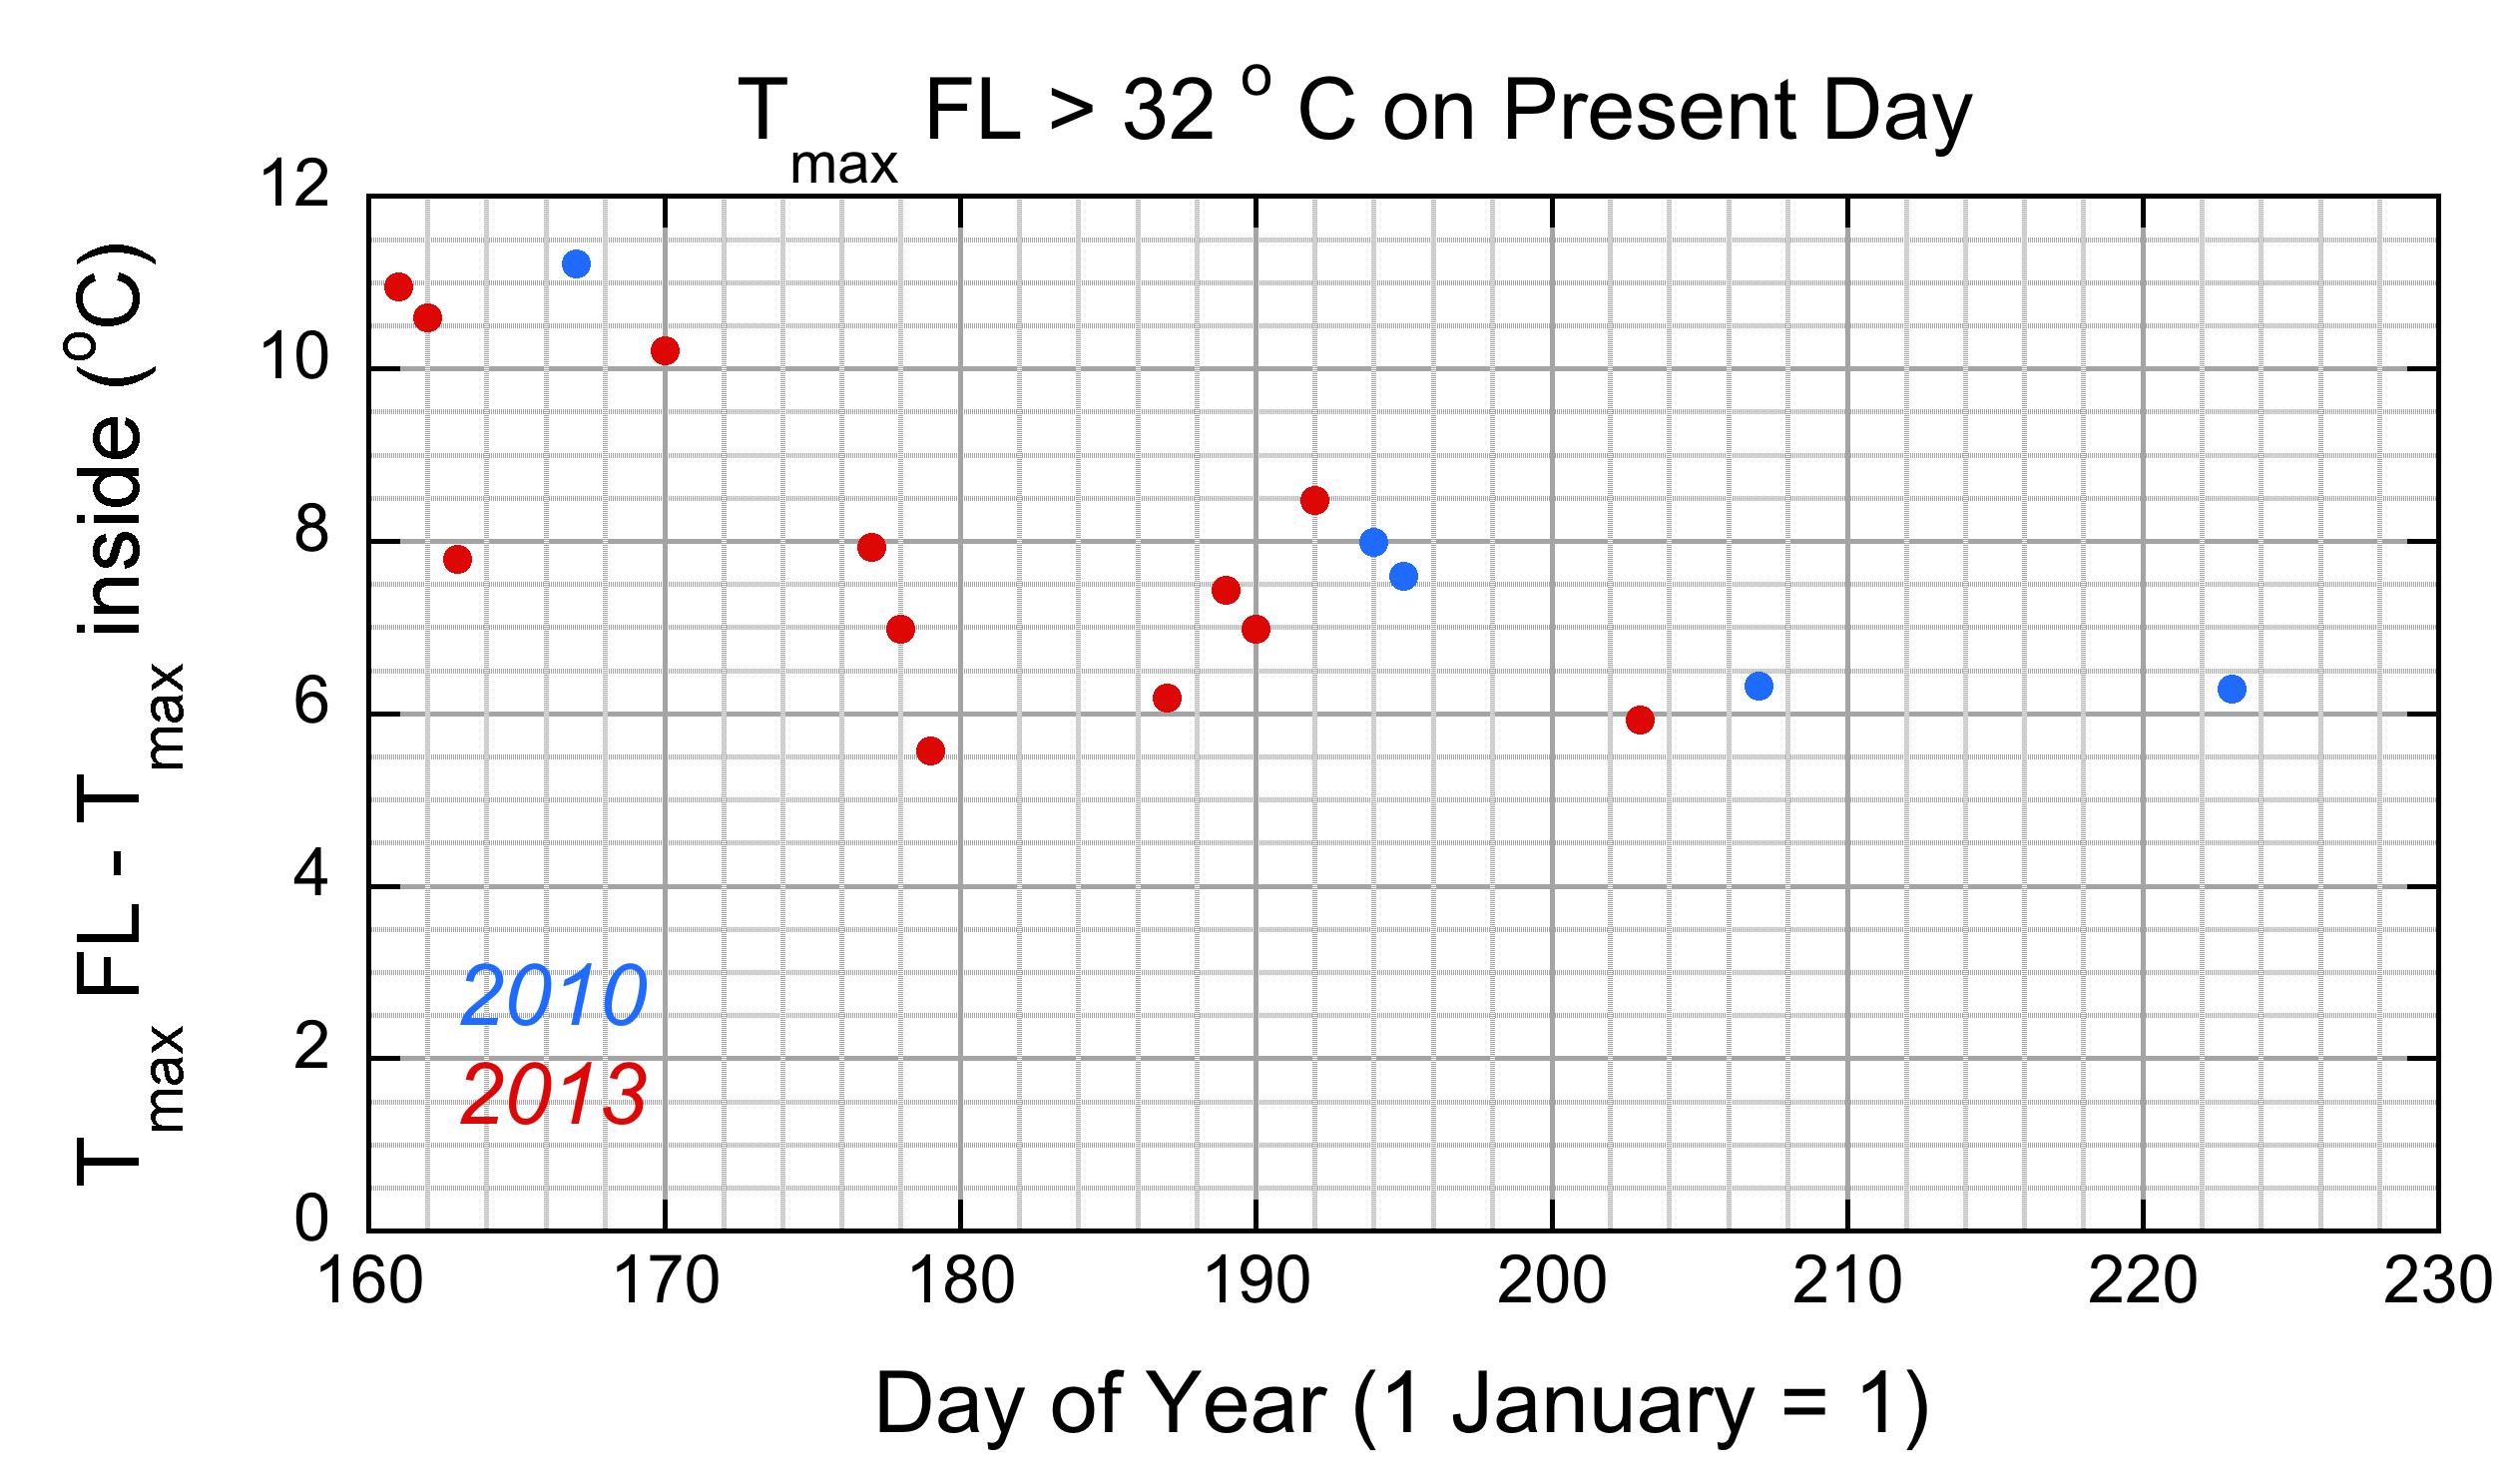
Figure 4 (from Part I).  Difference between living-room max temperature and that at Foothills when outside temperature exceeds 32o Celsius.

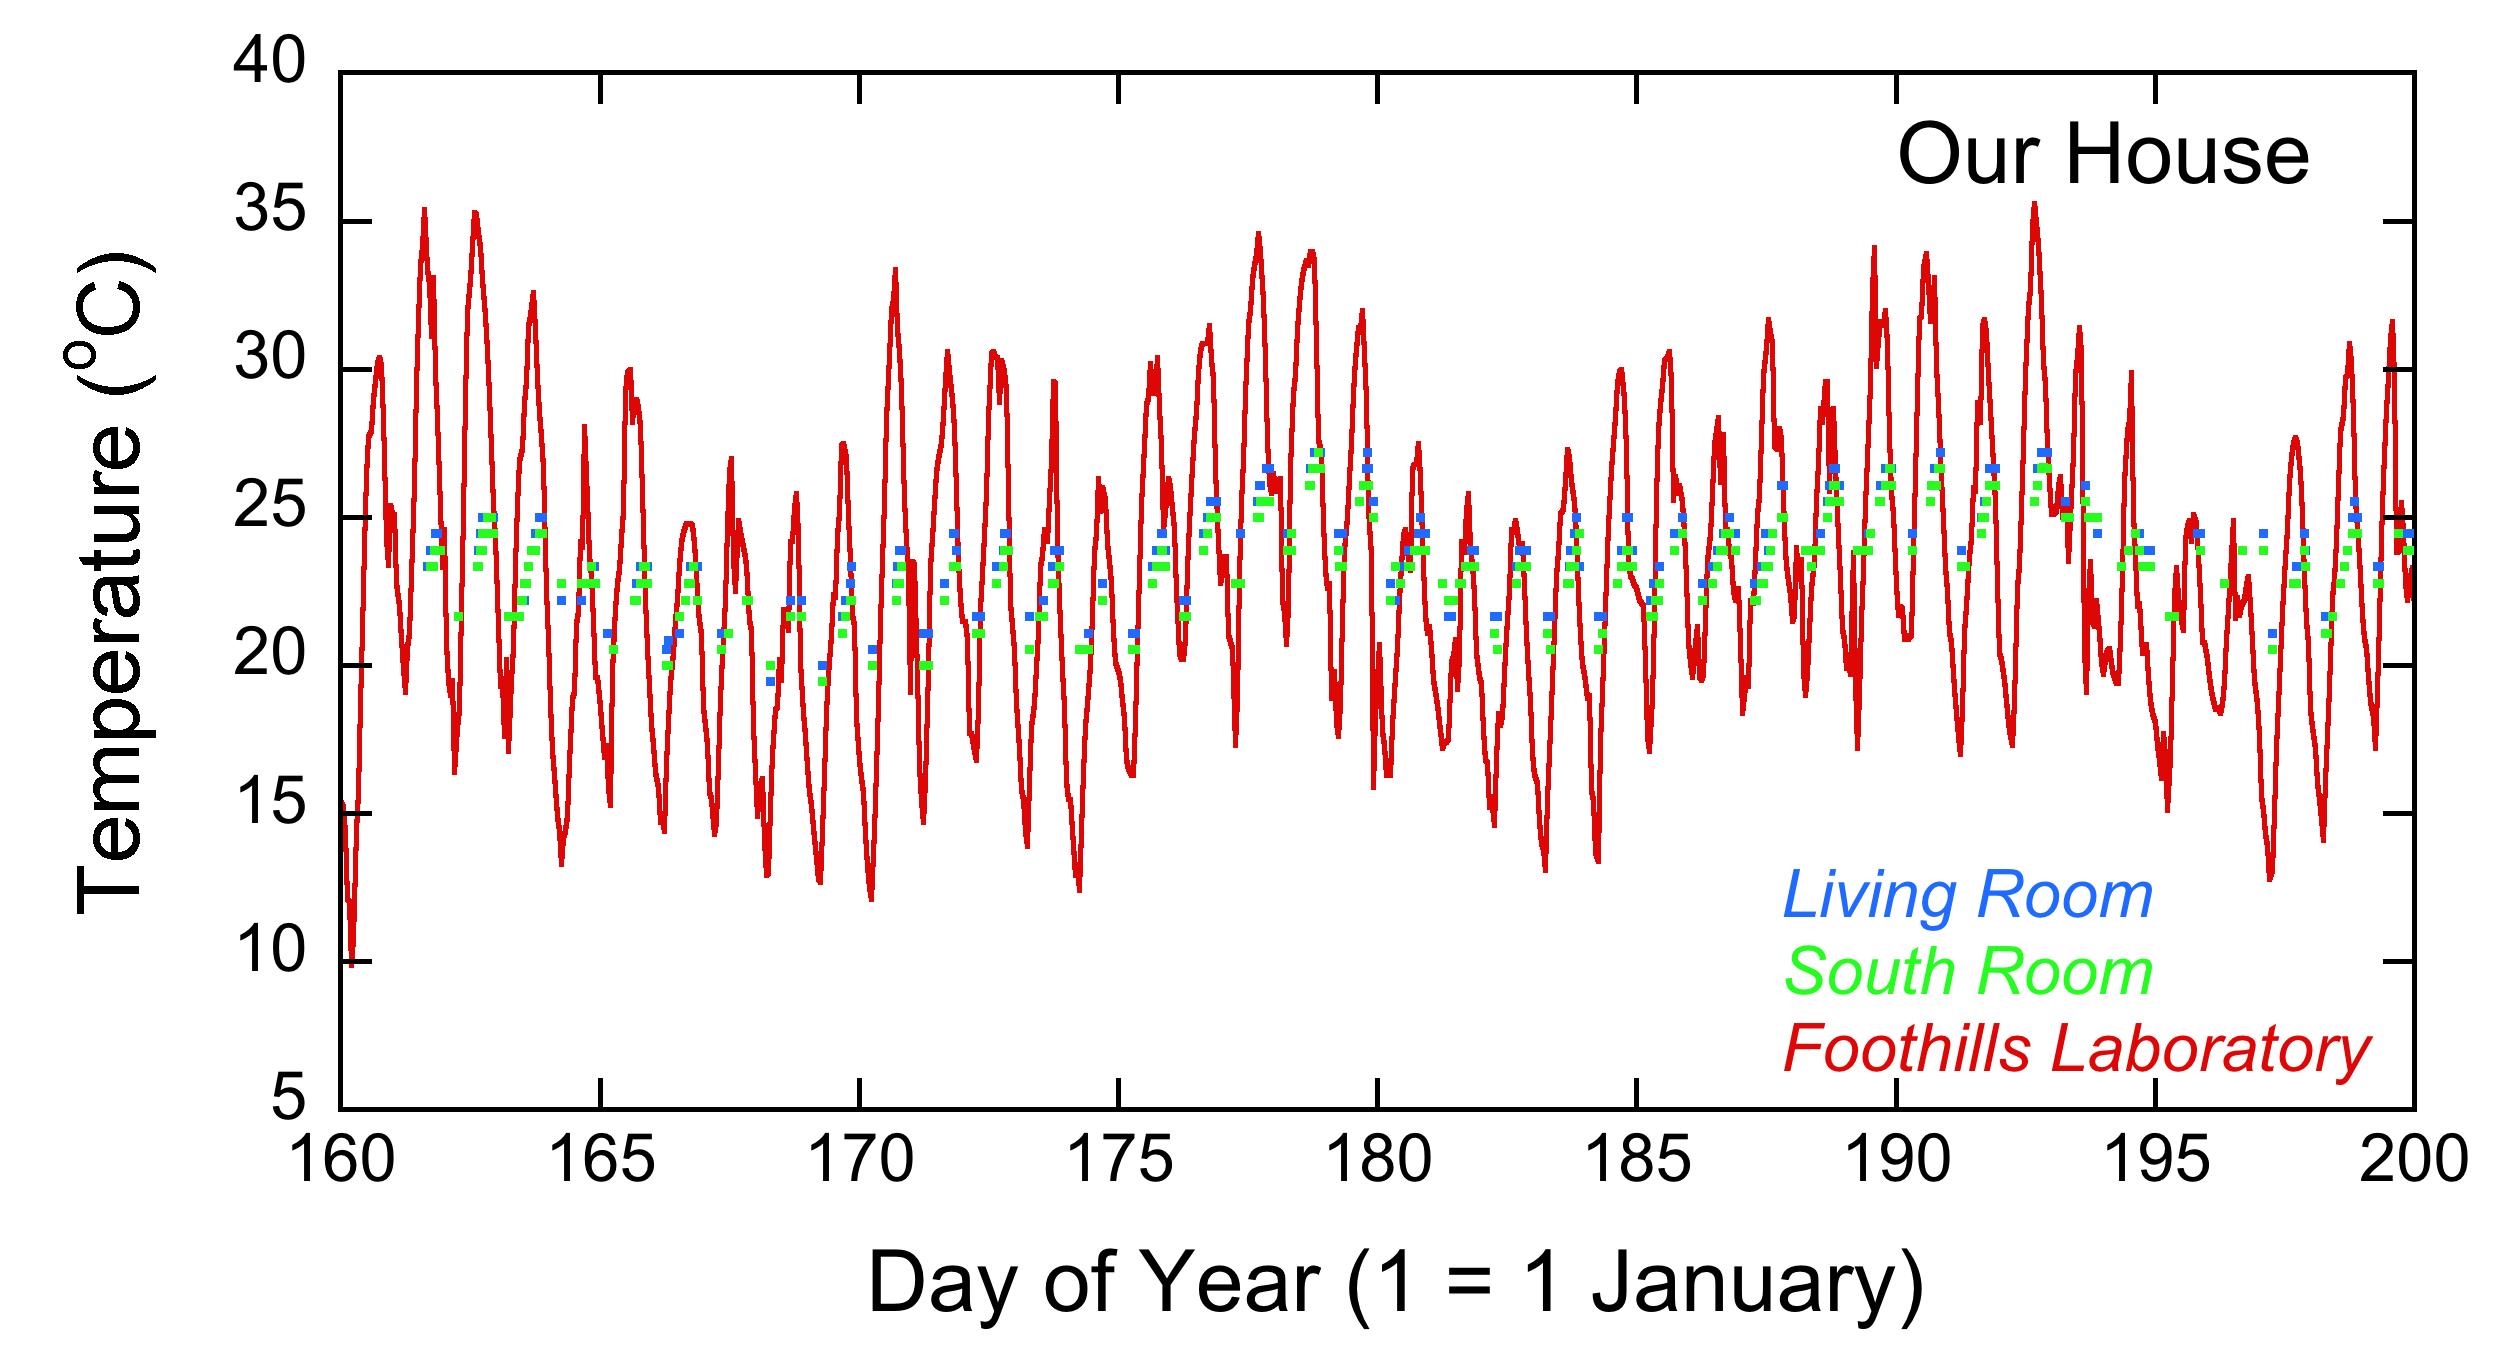
My hypothesis is that the “good” inside-outside temperature differences for 2010 can be traced to some very cool periods in the middle of the summer, as can be seen from Figure 1.  We took advantage of such cool periods to ventilate the house, which cools it (the walls, floors, etc.) enough to keep it cooler during the next period of warm temperatures.

PeggyBlog-KeepingCool-Part II Figure 1
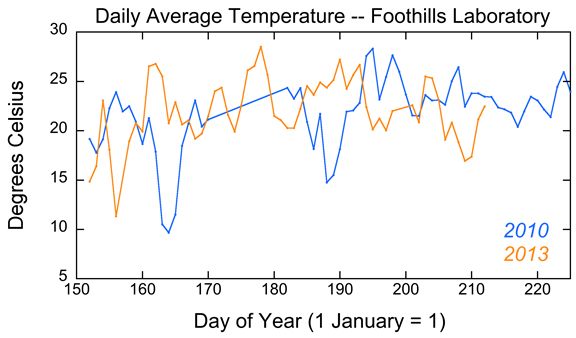
Figure 1.  Daily average temperatures at Foothills Laboratory, for 2010 and 2013.  Data are mixing between Days 170 and 185.

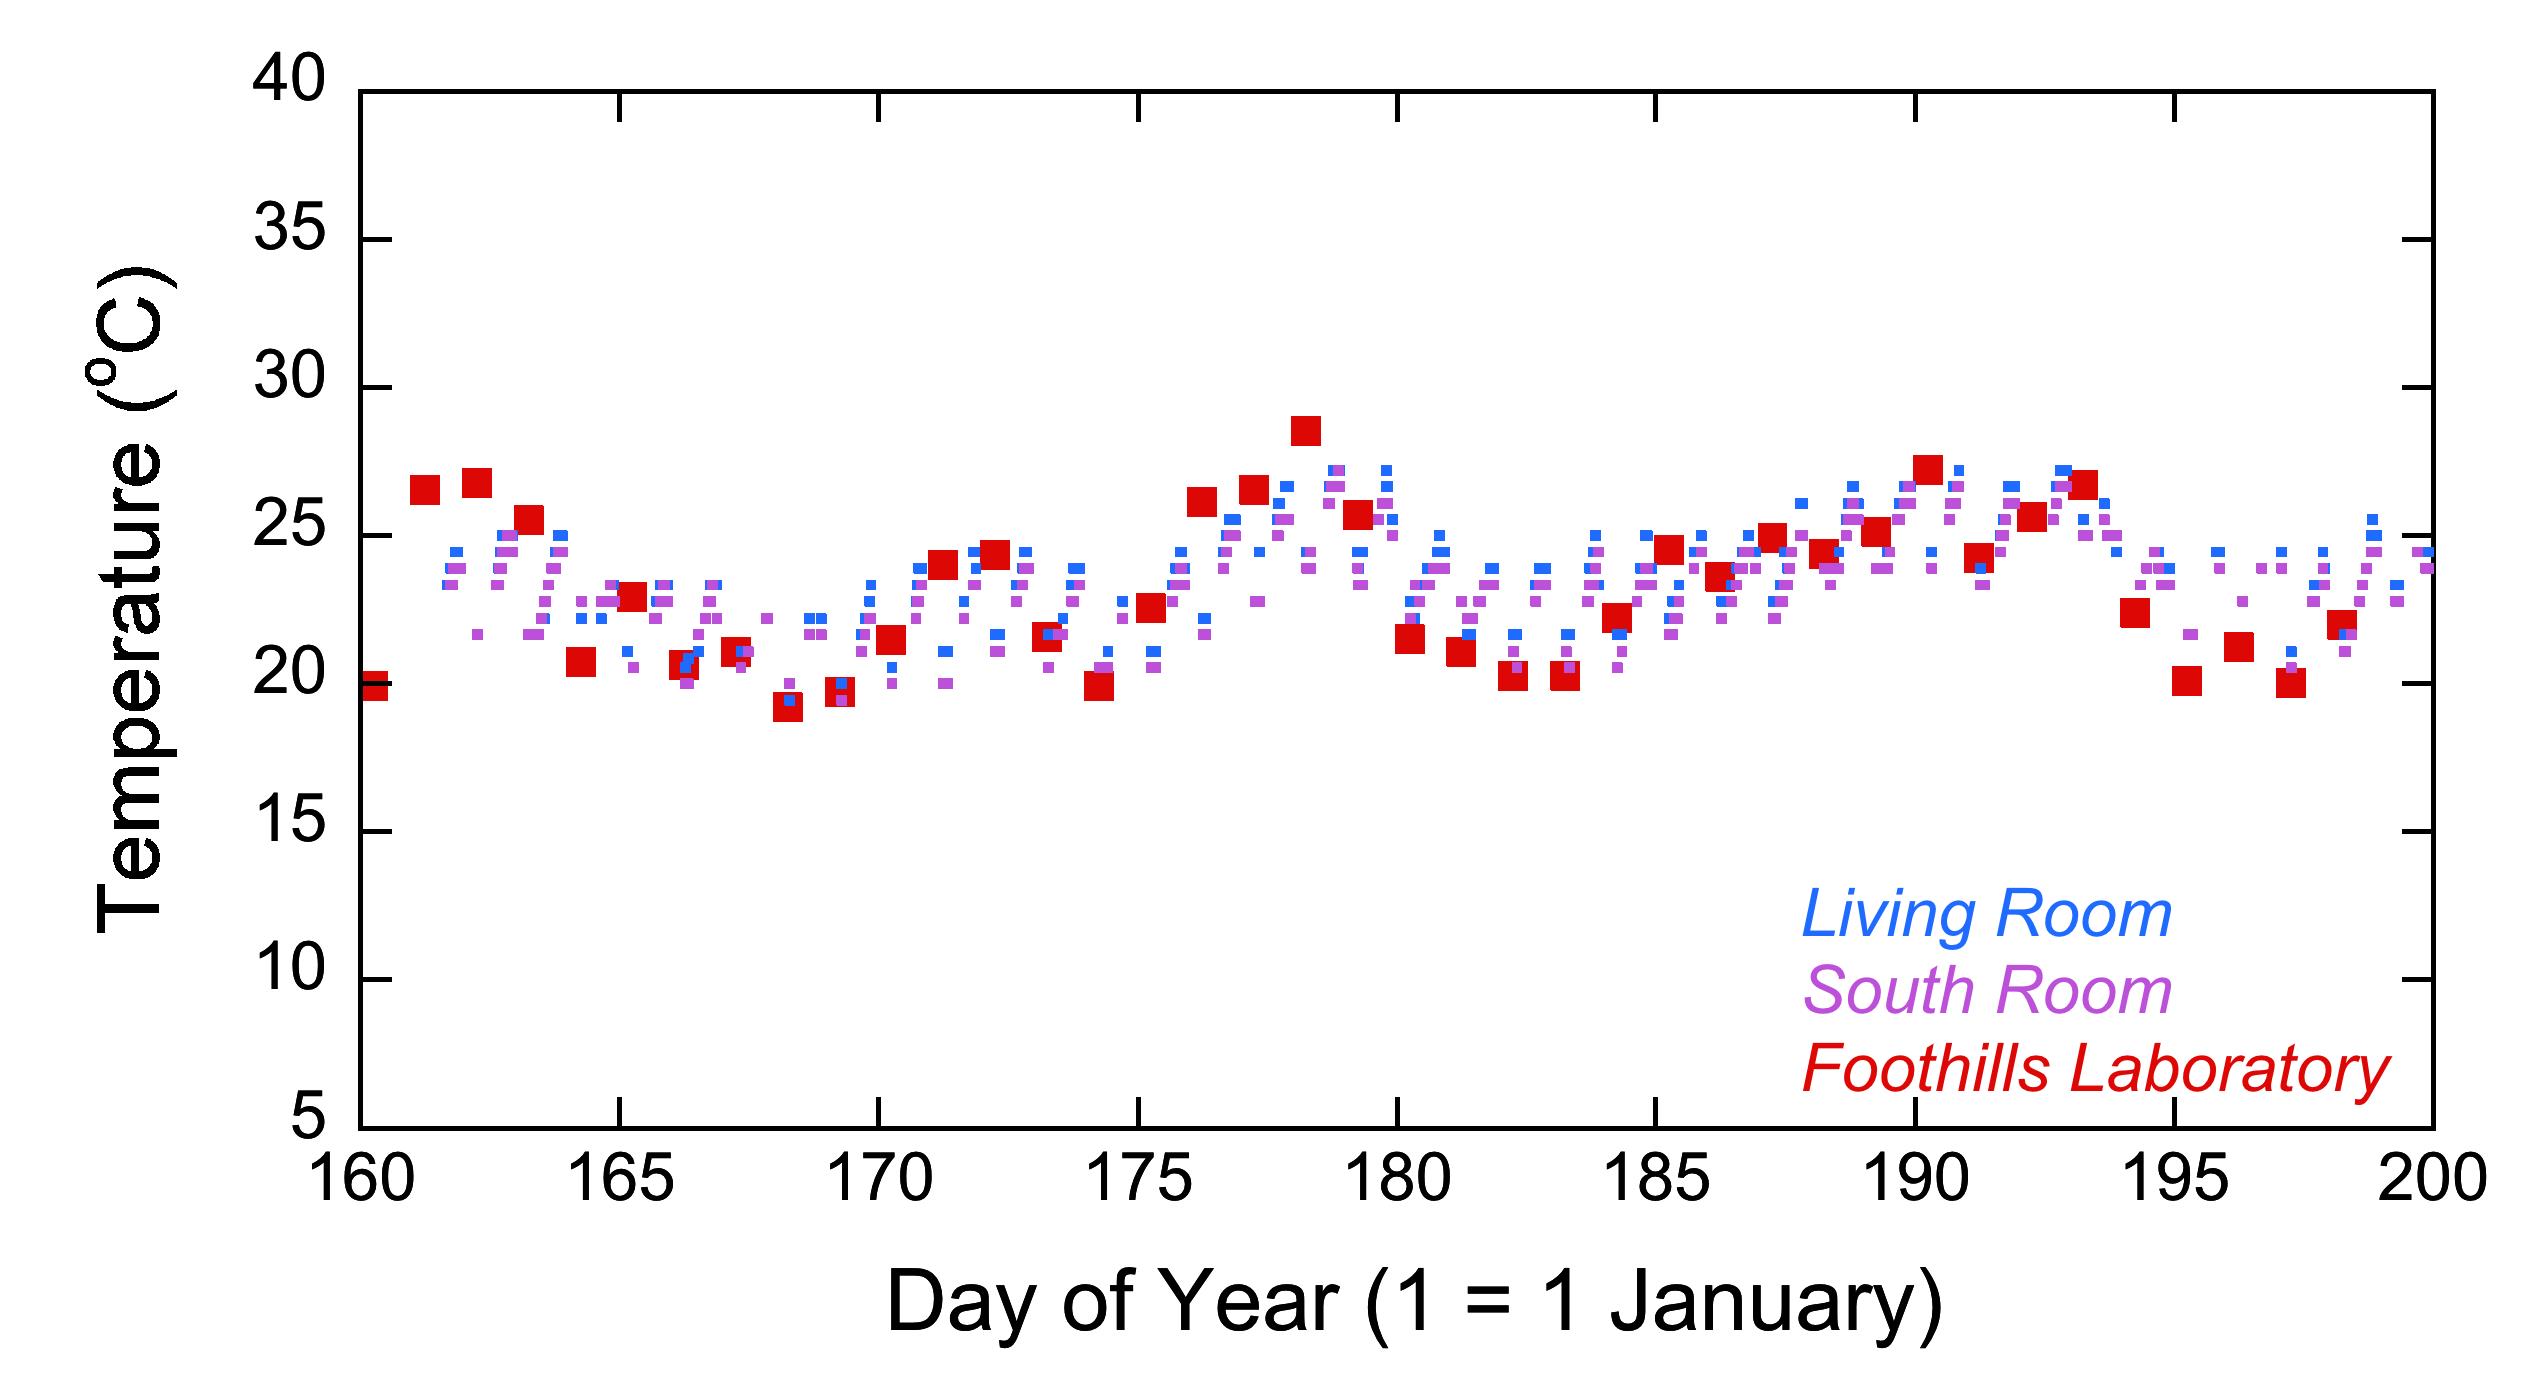
The second reason is that the insulation can only slow the warming of the house itself; it can’t stop it entirely.  (Were I to have data like that in Figure 3 from Part I for 2010, I would guess the daily swings of the inside temperature would be larger than for 2013.)

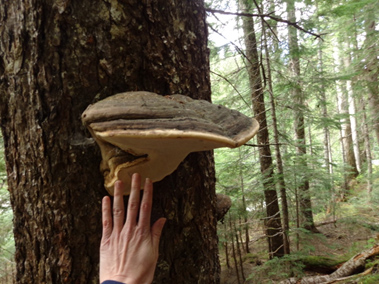
Perhaps easier to understand is an example from nature.  The soil temperature varies much less than the surface temperature. And, the farther down one gets, the less the temperature varies during the day – and during the year (see
http://globe.gov/explore-science/scientists-blog/archived-posts/sciblog/2008/03/17/puddles-and-soil-temperature-part-2-why-is-the-water-feeding-the-puddle-not-frozen/ for graph that shows this).   Surface vegetation, and soils closer to the surface insulate soils and rock farther down.

If you have ever taken a tour through a cave, the guide often mentions that the temperature in the cave is close to the average annual temperature for that location.  This is because the cave is far enough down that the insulating upper layers prevent much temperature change during the year.

People actually take advantage of this steady year-round temperature to moderate the temperature in their house.  Pipes are installed deep into the ground beneath a building.  During the summer months, fluid in the pipes is cooled by the surrounding earth; and the cool fluid is pumped up into the house to cool the air.  In the wintertime, the ground below the house is warmer than the air outside, so the same system can be used to help heat the house.

Does your school collect soil and air temperature data? Have you noticed a difference in these two datasets on very warm days? Let us know by adding a comment!

With Earth warming due to increased concentrations of greenhouse gases in the atmosphere, do you think caves are warming as well?  Why?   In what parts of the world would caves warm the most?  Why?


Posted in General Science | 11 Comments

Keeping cool in the summer, Part I

This week we again welcome long-time friend of GLOBE, Dr. Peggy LeMone, Chief Scientist for the GLOBE Program from 2003-2009, as our guest blogger. Dr. LeMone is currently working in the field of weather and cloud formation at the National Center for Atmospheric Research (NCAR).

Peggy Lemone

Dr. Peggy LeMone,
Credit: UCAR

Today, many homes and public areas have air conditioners to keep families cool during the hot months of the year.  This was not true 50 years ago, when a visit to the movie theater (which was air-conditioned) or a swim in a nearby lake, ocean, or swimming pool would ease the heat.  Hospitals in the town where I grew up would cool their operating rooms by bringing in big pieces of ice.

Though many homes in Colorado have air-conditioning, the climate is sufficiently mild that a large percentage of families, including mine, do not have air conditioning.  I’d like to share a strategy my family has adopted to keep us comfortable most of the time.

Being scientists, my husband and I open and shut the doors, windows, and window shades of our house according to the temperature inside and outside of the house.  Figure 1 displays the air temperature of a typical day.

PeggyBlog-Figure1

Figure 1. Temperatures around our house, and at NCAR’s Foothills Lab, about 3.3 kilometers to the east. To convert afternoon times to p.m., simply subtract 12.

We use the digital thermometers on our two furnaces for the temperature inside the living room and the room to the south.  The outside thermometer, on our deck, has not been properly shielded since we had to remove a tree.  Thus we include a nearby temperature measurement, from the National Center for Atmospheric Research (NCAR) Foothills Lab, for comparisons.

During the day, we typically keep the house closed up – this means all windows and doors closed and many shades down — until the air outside is cooler than the air in the house.  As you can see from the graph, this happens around 22:00 (or 10:00 p.m.) Mountain Daylight Time (MDT), so direct sunlight on the deck thermometer is no longer a problem.   Once the indoor and outdoor temperatures are equal, we open up the windows, and use fans to bring in the cool, outside air.  The following morning, if we are at home, we again close up windows and doors when the outside temperature increases to the same as the inside temperature.   During the week, we close up the house when we leave.  The net effect of this strategy is to keep the house cool during the day – more than 10 degrees cooler at the time of maximum outside temperature!

You might notice that the air temperature inside the house keeps increasing, long past the time of the maximum outside temperature.   This may seem odd at first, but it makes sense:  as long as the air outside the house is warmer than the air inside, the house will continue to be warmed.  Of course if we left the windows open all day, the high temperature inside the house would occur closer in time to the outside maximum temperature (and of course the temperatures would be closer as well).

How does this work from day to day?  Figure 2 compares the outside temperatures at Foothills Lab to our indoor temperatures between 9 June and 7 July.   The inside temperatures vary less during the day than those outside (as seen in Figure 1).  They also vary less from day to day.  The largest differences between inside and outside maximum temperatures are on the hottest days.

PeggyBlog-Figure2

Figure 2.  Inside and outside temperatures from 9 June (Day 160) through 19 July (Day 200).

Notice that the inside minimum temperatures remain warmer than those outside, in spite of our trying to draw in outside air.  The house temperatures also vary less than the daily average temperatures, as seen in Figure 3.

PeggyBlog-Figure3

Figure 3.  For the same period of time, but with daily average Foothills Lab temperature.

If you look carefully at Figure 2, you can see that the opening and closing strategy doesn’t work as well in late summer, with inside temperatures closer to outside temperatures.   This effect becomes even more obvious in Figure 4, which shows the difference between the inside and outside temperature maxima for the hottest days.  (Note that data weren’t collected every day in 2010, so there could have been more warm days.)

PeggyBlog-Figure4

Figure 4.  Difference between living-room max temperature and that at Foothills when outside temperature exceeds 32o Celsius.

How is the indoor air temperature regulated at your home or school? Let us know by adding a comment!

Posted in General Science | 24 Comments

Next Generation Science Standards – Not the Common Core

GLOBE teachers across the United States are hearing more and more everyday about the Next Generation Science Standards (NGSS).  My home state of Michigan was one of twenty-six Lead States that were involved in the process of reviewing the standards and Dave Bydlowskisuggesting changes.  Hopefully, Michigan will soon adopt the standards, which will replace our current Science Grade Level Content Expectations (GLCE) and High School Science Content Expectations (HSSCE).  Eight states have adopted the standards, as of this writing.  The development of the standards has taken nearly two and a half years.  But during this time, there still seems to be confusion in mistaking the NGSS with the Common Core.

The NGSS is NOT the Common Core in Science.  NGSS is a set of standards that were developed outside of the Common Core process.  There are a few reasons causing this confusion:

  1. They were developed during the adoption process of the Common Core.
  2. The Common Core in English Language Arts (ELA) contains literacy standards for science, which help students improve their ELA skills in the science content area, but they are not science standards.
  3. The NGSS contain connections to the Common Core.

A Standard in the Next Generation Science Standards is composed of three parts:

  1. Performance Expectation(s) which describe what a student is expected to do at the end of instruction.  Performance Expectations are composed of three dimensions – a science / engineering practice; a disciplinary core idea in life, physical or earth science; and a crosscutting concept which provides unity across the disciplines of science.
  2. Foundation Boxes which contain the learning goals that students should achieve through the science / engineering practices; disciplinary core ideas; and crosscutting concepts.  The information in the foundation boxes is taken directly from the “A Framework for K-12 Science Education” which provides the foundation for the standards.
  3. Connection Boxes, which identify science connections across grade levels and disciplines as well as identifying connections to the Common Core State Standards in Mathematics and ELA.

These connection boxes provide a wealth of information for teachers and curriculum developers in aligning and integrating science, mathematics and English Language Arts.  Screen Shot 2013-11-19 at 2.14.44 PMHere is an example of a standard from the NGSS that provides a connection to the Mathematics Common Core:

  • Grade Level – Middle School (6th – 8th Grade)
  • Topic – Weather and Climate
  • Performance Expectations
    • MS-ESS2-5. Collect data to provide evidence for how the motions and complex interactions of air masses results in changes in weather conditions.
    • MS-ESS2-6. Develop and use a model to describe how unequal heating and rotation of the Earth cause patterns of atmospheric and oceanic circulation that determine regional climates.
    • MS-ESS3-5. Ask questions to clarify evidence of the factors that have caused the rise in global temperatures over the past century.
    • Connection Boxes for Mathematics
      • MP.2 – Reason abstractly and quantitatively.
      • 6.NS.C.5 – Understand that positive and negative numbers are used together to describe quantities having opposite directions or values (e.g., temperature above/below zero, elevation above/below sea level, credits/debits, positive/negative electric charge); use positive and negative numbers to represent quantities in real-world contexts, explaining the meaning of 0 in each situation.
      • 6.EE.B.6 – Use variables to represent numbers and write expressions when solving a real-world or mathematical problem; understand that a variable can represent an unknown number, or, depending on the purpose at hand, any number in a specified set.
      • 7.EE.B.4 – Use variables to represent quantities in a real-world or mathematical problem, and construct simple equations and inequalities to solve problems by reasoning about the quantities.

These connection boxes are an extremely important component of the NGSS.  Without the connection boxes, we do not have standards, we only have performance expectations with foundation descriptions containing learning goals.  There are rumors that some states will only adopt the performance expectations without the foundation and connection boxes.  This should be avoided at all costs.  One of the major goals of the NGSS is to have science standards, which coordinate with “Common Core Standards” in English Language Arts and Mathematics.

So, the next time you hear someone call the new science standards “the common core” remind them that they are not the common core, but they are a new set of science standards called the “Next Generation Science Standards,” which provide a critical connection to the common core in mathematics and ELA.

For more information, check out GLOBE’s NGSS Pinterest page and NGSS Webinars for resources and connections to NGSS.

David Bydlowski

GLOBE Partner — Wayne County Mathematics and Science Center at Wayne RESA

bydlowd@resa.net


Posted in General Science | 8 Comments

Water scarcity: what it means for countries in the Near East and North Africa

Do you remember last year when we examined the Near East and North Africa region and the potential problems that the region could face with a changing climate? This region is characterized by the Arid desert hot (BWh) Koppen-Geiger climate classification*.  A BWh classification is one where the mean annual temperature is greater than or equal to 18 °C and is too dry to support most plants.  With this climate classification, the region is extremely sensitive to shifts in climate.   This means that even small changes in climate, especially with regards to precipitation, can have dramatic effects on water scarcity.

Water scarcity occurs when the demand for freshwater exceeds the supply.  The factors that help identify the region as  BWh point to a region which relies strongly on water that comes from rivers to supply both drinking water as well as water for irrigation.  It is estimated that by 2030, the entire Near East and North Africa Region will be experiencing water scarcity (as shown by the red in the map below). 

cropscience_imageCaption: Water scarcity in 2030, image from cropscience.org.au

Reliance on freshwater from rivers in the Near East and North Africa region has inspired the Food and Agriculture Organization of the United Nations to launch a regional initiative to address water scarcity.  The Near East and North Africa Land & Water Days will take place in December 2013. The purpose of this event is to bring together policy makers, practitioners, donors and researches to share and learn together new and effective ways to enhance land and water use practices. Sessions at the event will discuss land and water management and technologies, such as drip irrigation.

Summits such as this one are important because they bring many different types of people together to discuss the climate and how to avoid water scarcity collectively. Members of the GLOBE community are involved in this too.  For example, students from the Yamama School in Saudi Arabia demonstrated how they work together in their Earth Day video competition earlier this year.

Youtube-Yamam-SchoolEarth Day video

The students used GLOBE protocols to identify the suitability of their drinking water and soil for growing crops and then provided local farmers with information on how to improve their agricultural yield.  Students are asked to visit farms and carry out research applications.

They hope that through these practices they can spread environmental awareness among their society.  For more information on how GLOBE students work together to learn about their environment and act as stewards in their community, see the entire collection of Earth Day videos.

Suggested activity: Get involved in collecting data in your local area! Collecting any of the GLOBE atmosphere protocols is a great start to understanding your local climate better.  By collecting data and entering them into the GLOBE database, you can begin your observational record that you can watch change through the years.  Have you noticed anything that’s changed already?  We’d love to hear about it!  Leave us a comment, send us an email or let us know about it on our Facebook Page!

* The Köppen-Geiger Climate Classification is one of the most widely used classification systems for determining climate. It was developed by climatologist Wladimir Köppen , later modified by climatologist Rudolf Geiger in collaboration with Köppen. To learn more about how your area is classified, see the “What is Your Climate Classification?” Learning activity.


Posted in General Science | 21 Comments

Mt. Rainier: Rich in beauty and science

We’d like to welcome Dr. Angela Rowe as our guest blogger.  Dr. Rowe is currently a postdoctoral scholar (“postdoc”) at the University of Washington.  While living in the Pacific Northwest of the United States, she enjoys taking her science training outdoors as she explores the local landscape.  She recently hiked Mt. Rainier in Washington State, USA and wanted to share her experience.   

While sitting on the shores of Lake Washington on a sunny summer Seattle day, it’s difficult to miss the snowy tops of Mt. Rainier, which reaches 4.39 km above sea level. Since it’s nearly 2.5 km above the highest peaks of the adjacent Cascade Mountains, this volcano is greatly impacted by the storms that come in from the Pacific Ocean and is typically covered with snow well into the late summer.

Blog-Image1-MtRainier

View of Mt. Rainier from Lake Washington in Seattle, Summer 2013.

Paradise, an area located at roughly 1580 meters on the south slope of Mt. Rainier, is one of the snowiest places in the United States, receiving roughly 1600 cm of snow during an average winter. During the winter of 1971-72, it reached a record seasonal snowfall of 2850 cm – over 28 METERS of snow! With that kind of snowfall, it’s no surprise that glaciers cover over 90 square kilometers (km2) of the mountain. According to the National Parks Service, Mt. Rainier’s Emmons Glacier has the largest surface area (11.1 km2). On a recent trip to Paradise (that’s so nice to say, isn’t it?), I was able to see a stunning view of the Nisqually Glacier, although the top thousand meters of Mt. Rainier was lost in the clouds.

Blog-Image2-NisquallyGlacier

View of Nisqually Glacier on the south side of Rainier from Paradise. Summer 2013.

                Clouds are the norm at these high elevations, and although I didn’t see the top of the mountain on that day, I was lucky enough to be at an elevation at Paradise where I was in between the altostratus cloud layer that was hiding Rainier’s peak and the stratus deck below that was encompassing the lower elevations of the park. The tops of nearby mountain peaks of the Tatoosh Range peered through this lower cloud layer, and I must admit that this was one of the most breathtaking views I have ever seen.

Blog-Image3-TatooshRange

View of the Tatoosh Range peeking through the clouds from Paradise. Summer 2013.

Descending down the range, into the foggy, moist world of the park, it was clear how diverse the environment is along the slopes of this mountain due to the varying climate over a large range of elevations. Mt. Rainier National Park is 953.5 km2, 97% of which is designated wilderness, and contains both old growth forests and subalpine meadows. These rich, diverse landscapes house a variety of birds, mammals, amphibians, fish, and reptiles. During one visit, I encountered a northwest garter snake (Thamnophis ordinoides), salamanders (Order Caudata), slugs (terrestrial gastropods), a snowshoe hair (Lepus americanus), mule deer (Odocoileus hemionus), a ruffed grouse (Bonasa umbellus), and a surprisingly tame red-legged frog.

Blog-Image4-RedLeggedFrog

Photo of Rana Aurora (northern red-legged frog) near a stream. Summer 2013.

These moist forests are also home to a wide variety of fungus, from the fascinating corals to the common conks on old trees, and approximately 900 plant species, including colorful wildflowers. During a visit to the north side of the mountain, I even encountered the rare fairy slipper orchid (Calpyso bulbosa), appearing early in the summer after the snow melted at the lower elevations. What a beautiful sight!

Blog-Image5-largeConkOnTree

A large conk grows on a tree trunk on the northern slopes of Mt. Rainier

Blog-Image6-FairySlipperOrchid

The fairy slipper orchid (Calpyso bulbosa) growing near a river on the north side of Mt. Rainier.

When exploring the forests and snowfields of this mountain, it’s easy to forget that I’m standing on a volcano. The last eruption was estimated between 1820 and 1894 and geologists consider this mountain to be “episodically active”, meaning it will erupt again in the future. Since that last eruption, loss of glaciers has been over 20%, as the changing climate continues to influence precipitation patterns and temperature. Changes in the water cycle also affect tree growth and wildlife; a recent Mt Rainier National Park Climate workshop (March 2011), in addition to discussing these overall changes, also described a severe decline in amphibians overall in the western U.S., among other regions. While the direct cause and effects are still being sorted out, one thing that is clear is that the diverse environment of Mt. Rainier is changing. Although I’m aware of the risks of standing on an active volcano, it’s worth it to me to witness the frogs, mushrooms, old growth forests, glaciers and incredible clouds in this moment of time.

Suggested activity: Mt. Rainier isn’t the only such place to have such diverse biomes in a small area.  Mt. Kilimanjaro is another place.  GLOBE Students and Teachers have traveled up and down Kili and performed GLOBE protocols along the way.  You can read about their most recent experience here on the GLOBE Scientists’ Blog, as well as on the Xpedition’s pages.

Are you interested in clouds like the altostratus that Dr. Rowe observed? If so, visit the GLOBE Program’s Atmosphere investigation, where you’ll find learning activities and data collection protocols, as well as the GLOBE Cloud Chart to help you in identifying clouds.

Posted in General Science | 3 Comments