13 December 2007
I’ll have to say that I haven’t posted a message on the blog lately partly because I was busy with finals at the University of Toledo and my trip to San Francisco for the American Geophysical Union meeting. But, I also have had bloggers block. I didn’t know what to write about. Well, now I have a lot of things that I want to write about. Some of it will have to wait until next week.
All of the snow has melted in Toledo, Ohio. The temperatures over the last couple of days have gotten above freezing. You are all probably aware of the ice storm that hit the center of the country. That system caused a little bit of snow yesterday in Toledo but the forecast of 5-10 cm (2-4 inches) of snow did not pan out. But, the system caused a good amount of snow in southern New York state, Pennsylvania and even 25 cm (10 inches) in Boston, Massachusetts. Among the schools that have entered data for the surface temperature field campaign, White Cloud School in White Cloud, Michigan has reported 27 cm (11 inches) of snow on the ground.
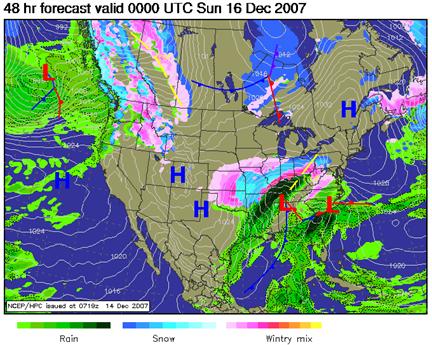
It looks like another major winter storm is going to move out of the mountains over the weekend, across the country, to the east coast of the U.S. (see Figure 1 below). The map shows the low pressure system will be over Tennessee Saturday evening and will be spreading snow from Oklahoma to Pennsylvania. It looks like the drought stricken parts of United States will be getting some much needed rain. This storm should be a good one with strong winds. The forecast for Toledo, Ohio is 10-15 cm (4-6 inches) of snow. Locations in the southern part of Ohio should get more snow as should the eastern United States. I bet all of the students will be wishing the storm had hit during the week….
It looks like the snow will stick around as well. After the storm goes by, much colder conditions are expected. The temperature should remain below freezing for several days at the minimum. I hope I can get out my cross country skis. Also, I’ll try to go sledding with my kids.

Figure 1. Forecast map for 0Z Sunday, 16 Dec. 2007 (which is Saturday night in North America).
Surface Temperature Satellite Data
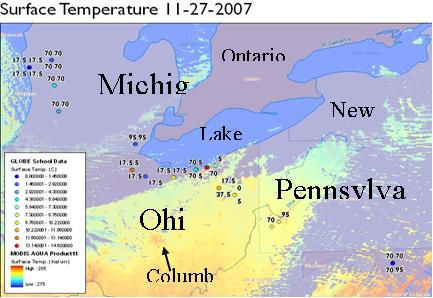
Timothy Ault, a Research Scientist at the University of Toledo, helped me by plotting up the students’ surface temperature observations. He took the student observations from the GLOBE Web site and plotted them in a Geographic Information System (GIS) to map the values overlaid on MODIS data from the Aqua satellite image. In the image below, you will see how much of Michigan, central Pennsylvania, and western New York are covered with clouds. [I apologize to the schools from Alaska, Iowa, Illinois, Estonia and Poland that are not on this map. I wanted to show what could be done with the data so I picked an area that covered the most schools possible.] The MODIS image was acquired from the rapid response Web site.
As you can see from the student measurements, the surface temperatures in Michigan under the cloud cover are much cooler than the surface temperatures in northeast Ohio and southwest Pennsylvania. The areas without cloud cover tend to have much warmer temperatures. When I was at AGU, Dr. Dorothy Hall from NASA Goddard Space Flight Center mentioned that scientists do not know the surface temperature under clouds because the clouds block the signal that the satellite can observe. This is a good example of how student observations are adding to our scientific knowledge. The students can measure something that the satellites can’t.
The students’ observations of cloud cover are denoted by the numbers to the left or above the circle. These are the nominal cloud cover percentages associated with the categories of the GLOBE observations. Clear – 5%, Isolated – 17.5%, Scattered – 37.5%, Broken – 70% and Overcast – 95%. You might be able to see that the student cloud cover observations do not seem to match the MODIS cloud observations especially in northern Ohio and southwest Pennsylvania. Why do you think that is? If you notice, Tim did not put the time the satellite went over and the time of the student observations on the map. Would the time of observation of clouds be important? And could that be the reason that there are differences?
In the MODIS image, you can see the urban heat island effect. I have an arrow pointing out Columbus, Ohio which shows up clearly as warmer than the rural areas surrounding it. Dayton, Ohio and Pittsburgh, Pennsylvania also show up warmer as well.

Figure 2. Student observations of surface temperature mapped onto a surface temperature MODIS image for 27 November 2007. The surface temperature measured by the students is in the circles and color coded according to the legend on the left. The number above or to the left of the circle is the nominal cloud cover percentage.
As of this morning, we are up to 556 observations from 32 schools. I was able to add the observations from the University of Toledo last night. It is nice to see so many observations coming in. Not that this is a competition, but the students from some schools are putting a lot of effort into the field campaign. I’m very impressed. I put the number of observations next to the schools with more than 20 observations.
| Roswell Kent Middle School, Akron, Ohio, USA – 37 observations Rockhill Elementary School, Alliance, Ohio, USA – 28 observations Dalton High School, Dalton, Ohio, USA – 64 observations Chartiers-Houston Jr./Sr. High School, Houston, Pennsylvania, USA Cloverleaf High School, Lodi, Ohio, USA – 37 observations The Morton Arboretum Youth Education Dept., Lisle, Illinois, USA Mill Creek Middle School, Comstock Park, Michigan, USA Kilingi-Nomme Gymnasium, Parnumaa, Estonia – 22 observations Polaris Career Center, Middleburg Heights, Ohio, USA National Presbyterian School, Washington, DC, USA White Cloud Public, White Cloud, Michigan, USA – 33 observations Blue Valley High School, Stilwell, Kansas, USA Perkins Middle School, Akron, Ohio, USA Steeple Run School, Naperville, Illinois, USA Kittrell Elementary School, Waterloo, Iowa, USA Lorain Community College Early College High School, Elyria, Ohio, USA – 46 observations Ingomar Middle School, Pittsburgh, Pennsylvania, USA Moosewood Farm Home School, Fairbanks, Alaska, USA – 21 observations Roxboro Middle School, Cleveland Heights, Ohio, USA Bowling Green State University, Bowling Green, Ohio, USA – 28 observations Ida Elementary School, Ida, Michigan, USA Whitehall High School, Whitehall, Michigan, USA – 22 observations Taaksi Basic School, EE2914, Viljandimaa, Estonia Birchwood School, Cleveland, Ohio, USA – 34 observations Gimnazium in Toszek, Toszek, Poland – 20 observations Waynesboro Senior High School, Waynesboro, Pennsylvania, USA Eastwood Middle School, Pemberville, Ohio, USA Orange Elementary School, Waterloo, Iowa, USA Estes Park High School, Estes Park, Colorado, USA Hudsonville High School, Hudsonville, Michigan, USA University of Toledo, Toledo, Ohio, USA Main Street School, Norwalk, Ohio, USA – 20 observations |
Take care,
Dr. C
