This is the start of the last week of the surface temperature field campaign.
Wow, the weather around the Northern Hemisphere sure has been active. It looks like in the United States we are going to have a good old-fashioned winter with cold temperatures and stormy conditions.
Can you tell that I like winter?
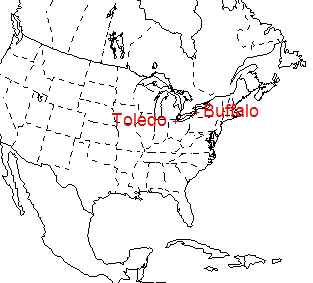
I started to take an interest in weather when I was 10 years old growing up in a suburb of Buffalo, NY. Buffalo is at the eastern end of Lake Erie. The area receives significant snowfall each year called lake-effect snow. This is caused by cold air from Canada passing over the warm water in fall and winter. The air collects water vapor from Lake Erie as it crosses the lake and deposits in on the downwind side. In 1977, there was an incredible blizzard in Buffalo called the Blizzard of ‘77. School was cancelled for 5 days straight. I thought it was the best thing going. Funny, though, that my love of missing school has turned into a love for winter weather and led to my career as a professor.
Here is a recap of what has happened over the last week. There has been flooding in Hawaii as well as in Italy.

Figure 1. Location of Buffalo (New York) and Toledo (Ohio) on map of the United States.
New England Ice Storm
New England received a terrible ice storm. The storm slowly moved up the east coast of the United States and produced up to an inch of ice on tree limbs and power lines. Many trees were damaged and power lines were brought down, knocking out electricity to over a million people.
Rare snow in Texas and Louisiana
The same system that caused the ice storm produced measurable snow as far south as Houston, Texas and Lake Charles, Louisiana. See the snow cover map below to see where the snowfall occurred. Kids had a lot of fun making snowmen and throwing snow balls.

Figure 2. Snow depth map for 12 December 2008.
Blizzard in Montana, North Dakota, South Dakota and Minnesota
The weather pattern has changed dramatically. When the ice storm occurred, there was cold air and storminess in the eastern United States. The western United States was warm and calm. That has now changed. A significant winter storm has moved into the western United States. This has given much needed snow and rain to Washington, Oregon and California. This system has been accompanied by extreme cold temperatures in the Canadian plains and northern United States. High temperatures were in the –15º C range. That’s cold by anybody’s standard. The strong high pressure system in Canada that brought the cold air along with the storm system (low pressure system) produced very strong winds in Montana, North Dakota and South Dakota. This produced dangerous conditions, white-out snow conditions, drifting snow and dangerous wind chills. I have experienced four real blizzards in my lifetime. To be a blizzard, the wind speed has to be greater than 35 mph (16 m/s), visibility has to be below a ¼ mile (0.4 km), and temperatures have to be cold for three hours straight. The blizzard of ’77 in Buffalo was by far the worst blizzard I was ever in. Blizzard conditions lasted for three days straight.
Cold temperatures in Toledo, Ohio produced early ice
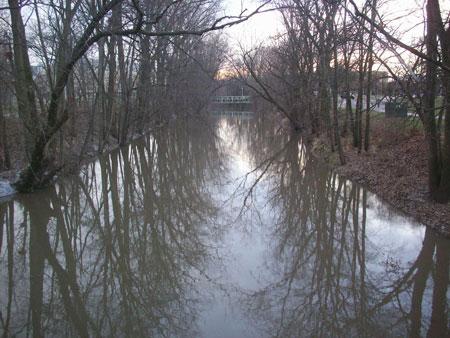
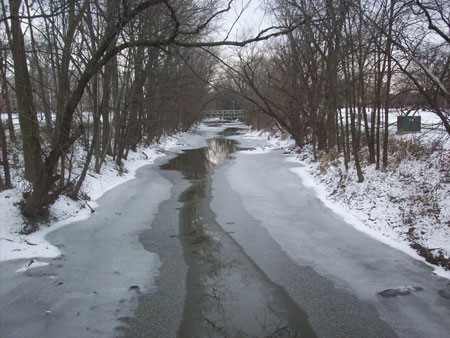
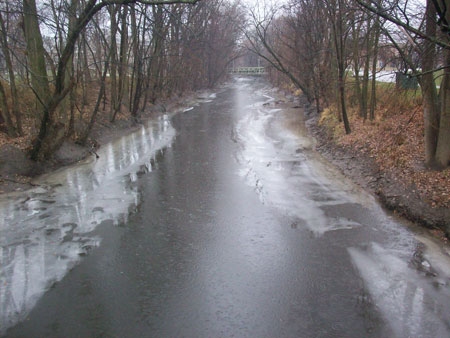
Where I live near Toledo, Ohio, most of November and thus far in December have been colder than the long-term average. In fact, so far in December, temperatures have averaged 4º C (7º F) below the long-term average. Ice has formed on ponds, lakes and rivers. My students and I are studying the Ottawa River that flows through the University of Toledo campus. We are doing this as part of GLOBE’s Seasons and Biomes Project. We are studying the way in which the river freezes and thaws. The observations were taken from a foot bridge and an attempt was made to keep the same part of the river in the frame. You can see in the images below that the river was ice free on 3 December 2008. By 8 December 2008, ice extended out from the banks of the Ottawa River about 4/10 of the way out on both sides of the river. There was a small area of open water down the middle of the river. Lastly, the ice started to melt on 9 December 2008 and then was completely gone by 10 December 2008 when there was quite a bit of rain. This week-long freeze up and thaw down pattern is common in Toledo, Ohio due to the changeable weather.

Figure 3. Ice on the Ottawa River, Toledo, Ohio, 3 December 2008
Figure 4. Ottawa River, 8 December 2008.
Figure 5. Ottawa River, 9 December 2008.

Figure 6. Ottawa River, 10 December 2008.
Here are schools that have entered data so far in the field campaign:
There have been 592 observations from 40 schools now recorded for the surface temperature field campaign. John Marshall High School in Glendale, WV has the most by far with 80 observations. Thanks Mrs. Clark, GO Monarchs! Peebles High School in Peebles, Ohio has logged 56 observations, thanks Mrs. Sheppard, and Dalton High School in Dalton, Ohio has reported 54, Thanks Mr. Witmer. And, thank you to all of the students from these schools.
Roswell Kent Middle School, Akron, OH, US [26 rows]
Dalton High School, Dalton, OH, US [54 rows]
Chartiers-Houston Jr./Sr. High School, Houston, PA, US [2 rows]
Lakewood Middle School, Hebron, OH, US [3 rows]
The Morton Arboretum Youth Education Dept., Lisle, IL, US [3 rows]
Peebles High School, Peebles, OH, US [56 rows]
Gimnazjum No 7 Jana III Sobieskiego, Rzeszow, PL [13 rows]
Penta Career Center, Perrysburg, OH, US [6 rows]
Canaan Middle School, Plain City, OH, US [20 rows]
Mill Creek Middle School, Comstock Park, MI, US [10 rows]
Brazil High, Brazil Village, TT [15 rows]
Kilingi-Nomme Gymnasium, Parnumaa, EE [16 rows]
Swift Creek Middle School, Tallahassee, FL, US [12 rows]
National Presbyterian School, Washington, DC, US [3 rows]
The Bryan Center, Bryan, OH, US [3 rows]
Maumee High School, Maumee, OH, US [12 rows]
Whittier Elementary School, Toledo, OH, US [4 rows]
Huntington High School, Huntington, WV, US [8 rows]
St. Joseph School, Sylvania, OH, US
Warrensville Heights High School, Warrensville Heights, OH, US [2 rows]
WayPoint Academy, Muskegon, MI, US
Gimnazium No 1, Sochaczew, PL [17 rows]
St. Michael Parish School, Wheeling, WV, US [4 rows]
Anthony Wayne High School, Whitehouse, OH, US [4 rows]
Bellefontaine High School, Bellefontaine, OH, US [20 rows]
Oak Glen High School, New Cumberland, WV, US [12 rows]
Nordonia Middle School, Northfield, OH, US [11 rows]
Orrville High School, Orrville, OH, US [6 rows]
Bowling Green Christian Academy, Bowling Green, OH, US [23 rows]
Polly Fox Academy, Toledo, OH, US [10 rows]
McTigue Middle School, Toledo, OH, US [3 rows]
Highlands Elementary School, Naperville, IL, US [8 rows]
South Suburban Montessori School, Brecksville, OH, US [20 rows]
NASA IV&V Educator Resource Center, Fairmont, WV, US
John Marshall High School, Glendale, WV, US [80 rows]
Birchwood School, Cleveland, OH, US [21 rows]
Orange Elementary School, Waterloo, IA, US
Hudsonville High School, Hudsonville, MI, US [19 rows]
The University of Toledo, Toledo, OH, US [25 rows]
Main Street School, Norwalk, OH, US [37 rows]
Dr. C


It seems that taking short term temperature readings…even from the last 100 yrs or so, can be misleading as to whether or not climate change is really happening.
Depending on one’s views as to the earth’s age…a rise or fall of temperature needs to be put into context.
Vvego