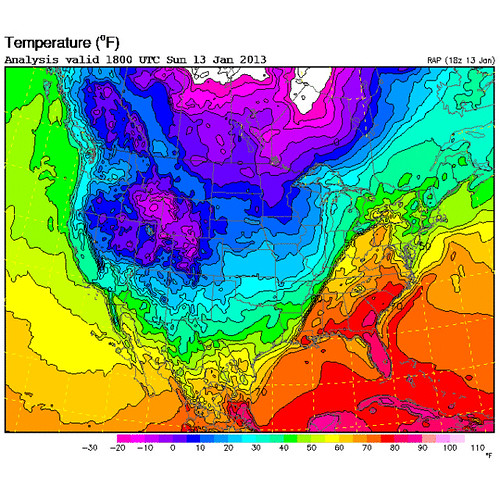
Weather extremes have become a common theme in the news headlines the past few weeks. For example, nearly every part of the United States has been experiencing one of two extremes – either frigid cold or record-breaking high temperatures. Places like Arizona and California experienced below-freezing temperatures, which can have potential impacts on the crops grown in these typically balmy regions. In contrast, cities in the Southeast U.S., such as Atlanta, Georgia, had record-breaking temperatures for this time of winter. In Atlanta, the high temperature of 24.4 °C (76 °F) broke the high temperature record set in 1890 by 1 full degree Fahrenheit. Take for example the following surface weather map, showing the vast extremes in temperature across the U.S. on January 13th, 2013:

Surface temperature map of the United States, from the RUC analysis at 1800 UTC on 13 January 2013; Image courtesy of RAL Real-Time Weather Data
When we looked at the weather map, we were amazed to see such a strong temperature gradient, which is how quickly temperature changes over a given distance. This was the result of a very strong cold front that moved across the country bringing chilling Arctic air into the heart of the U.S., where you can see some temperatures fell well below -17.8 °C (0 °F). Ahead of the cold front, temperatures soared, however only until the cold front passed. If you examine hourly observations from the Southeast U.S., you’ll find some dramatic temperature drops. For example, in Memphis, TN, the temperature fell nearly 8°C (18°F) in only one hour and fifteen minutes.
Outside of the United States, there are many other countries experiencing extreme weather. Thousands of people have had to evacuate their homes in Russia after a pipeline burst in the extreme and record cold and Jerusalem, Israel experienced a very rare snowfall last week. Conversely, Australia is experiencing raging brush fires as the country is gripped by a record-breaking heat wave. This heat wave has been so intense that road tar has melted and the Bureau of Meteorology had to add two new colors to its temperature maps.

Children play in front of the Dome on the Rock during the recent snowstorm in Israel; Photo from Reuters/Ammar Awad

A map from space showing hotspots from brushfires (red dots) in Tasmania; from NASA
While these are examples of weather extremes, they are not necessarily indicators of climate. It is important to reiterate the difference between weather and climate, as these kinds of weather extremes often get people talking about how it relates to climate and climate change. Weather is the current state of the atmosphere, the temperatures and weather systems that sweep through a nation over the course of a day or a week, while climate is the long-term average and trend of weather events over many years. Thus, while these weather extremes are dramatic on both ends of the spectrum, they may not affect a location’s climate unless they occur repeatedly, for many years to come. It is also important to realize that weather extremes are not uncommon; cold fronts often create sharp temperature gradients and weather patterns can set up to create heat waves or cold spells. However these extremes may be occurring more frequently and at record-breaking levels due to climate change.
In order to document extreme weather and if it is occurring frequently enough to impact climate, it is important to collect data on a daily basis for many years. Over time, these data help identify if any long-term trends are occurring. The GLOBE Program sponsors the Great Global Investigation of Climate project to encourage GLOBE schools to collect regular, daily temperature and precipitation data for this very reason. The data collection efforts of GLOBE schools help contribute valuable data to monitor weather and climate across the planet. Just look at this example from Fayetteville High School in Arkansas. The daily temperature observations of maximum temperature at their school over the past two weeks illustrate the warm up and then extreme cool down that occurred as the cold front passed on January 13th. These kinds of weather data, recorded over long periods of time, are the key pieces of evidence needed to help decipher if these tales of weather extremes are leading us toward a change in climate.

Maximum daily air temperature (degrees C) recorded by Fayetteville High School in Arkansas between 1-14 January 2013.
Suggested activity: Have you been affected by this recent extreme weather? Let us know about it by leaving a comment or sending us an email. Also, use the recent extreme weather to develop and carryout a research topic, then email it to us at science@globe.gov. And don’t forget to collect data for the Great Global Investigation of Climate, which repeats again in March!
- Jessica Mackaro and Sarah Tessendorf

That is frightening. I did not know that there are such differences in temperatures in the USA – not in December or January.