According to the most recent report by the Intergovernmental Panel on Climate Change, land use change has a relatively minor impact on the recent rise in global average temperature.
Yet, as stressed in an earlier set of blogs on Iowa Dew Points and an apparent increase in stormy activity regionally, land use seems to be quite important at local and even regional scales.
Why the difference?
According to an article by Raddatz in a recent issue of Agricultural and Forest Meteorology, about 3.6% of Earth’s surface is covered in crops, and about 6.6% is in pasture. Figures 1 and 2 show what these percentages look like. Even if all the temperature trends associated with changes in land cover were all in the same direction, it would require large changes indeed to show up significantly in the average global temperature for a whole year.
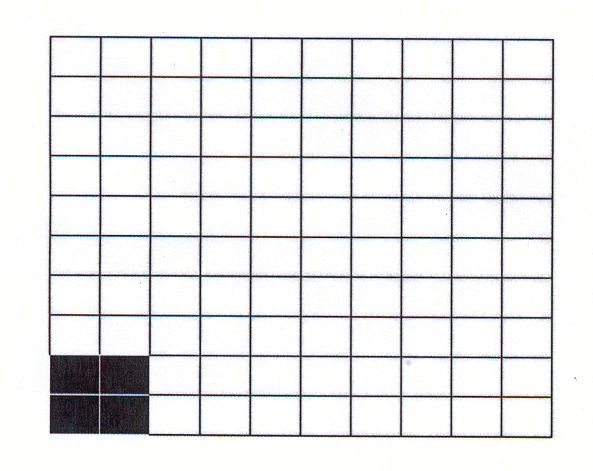
Figure 1. Fraction of Earth’s surface covered with crops, rounded up to 4%.
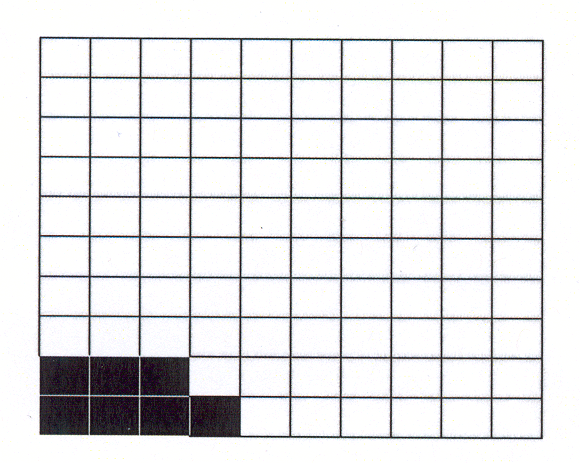
Figure 2. Fraction of Earth’s surface covered with pasture, rounded up to 7%.
Further, crops grow actively only part of the year. So, for example, winter wheat or corn will lead to cooler maximum temperatures during their growing season. (Recall this is because more of the sun’s energy hitting the surface is going into evapotranspiration and less into heating). During the rest of the year, the stubble or plowed ground would have a different effect from surrounding green vegetation. In fact, the dormant fields could be warmer than grasslands if the grasses are green. Thus it is not surprising that converting natural land cover to crops or pasture does not always have the same effect on temperature change. In some areas, there is a cooling effect (e.g., if more moisture is being evaporated or transpired, or if more sunlight is reflected), while in other areas, there is a warming effect (e.g., more sunlight absorbed, less evaporation or transpiration). And finally, as pointed out in the Iowa Dew Points blogs, regional changes in land cover could have an indirect effect, like shifting the wind patterns. This can in some cases decrease the local influence on temperature. Figure 3 illustrates the “mixed” effect of crops.
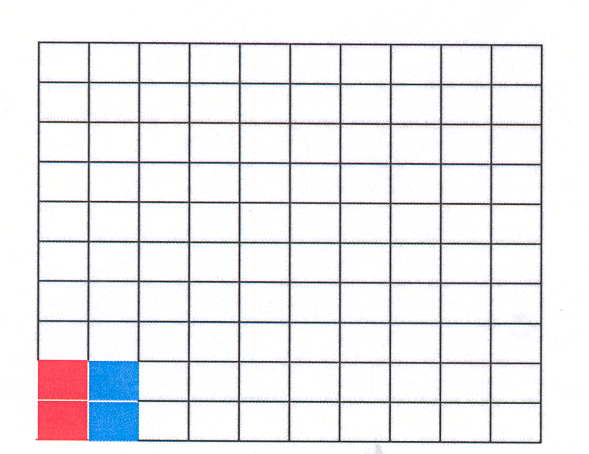
Figure 3. Possible scenario showing effects of crops on the global average temperature, with the “red” representing a net warming effect over the whole year, and the “blue” representing a net cooling effect. This is only to illustrate that the net effect of crops will be mixed, rather than saying what the effect will be.
As noted in earlier blogs, cities also affect the temperatures, but they occupy a tiny fraction of Earth’s surface.
This does not mean that land use isn’t important. We live on land, which occupies only 30% of the globe. If we change our percentages of Earth’s surface to percentages of Earth’s land surface, they become bigger – 3.6% of Earth’s surface becomes 12% of Earth’s land surface, and 6.6% of Earth’s surface becomes 22% of Earth’s land surface! Furthermore, we humans aren’t evenly distributed: there are vast parts of Earth that are uninhabited. Human influence on land cover is where humans are. And, of course, those seasonal effects on temperature are important to us if they are happening where we live.
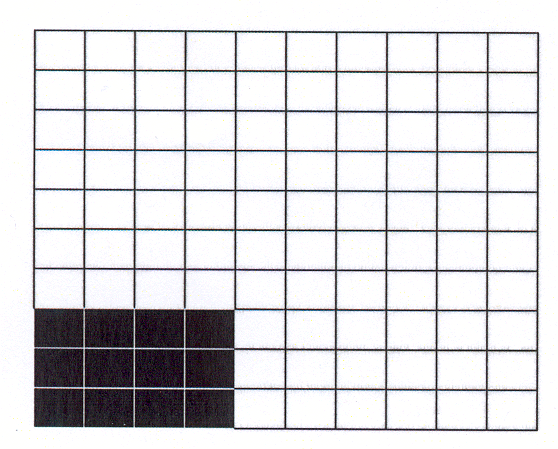
Figure 4. Fraction (12/100) of land surface on Earth covered with crops.
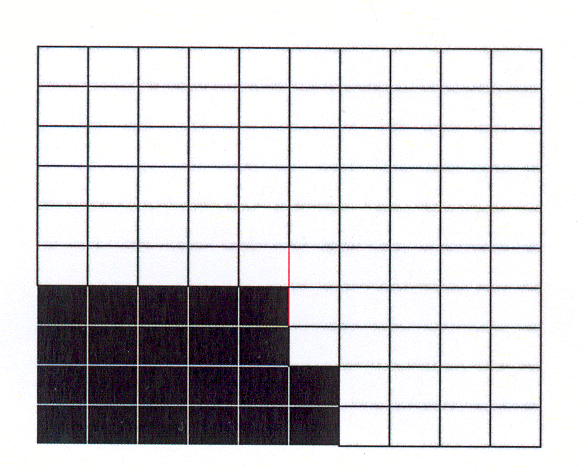
Figure 5. Fraction (22/100) of land surface on Earth covered with pasture.
Climate researchers know this. You have mainly heard about the predicted average annual temperature because it is the easiest “measure” that sums up all the details in one convenient number. This is particularly helpful in sending the message to governments, businesses, and individuals that Earth is getting warmer. Once you think about how this will affect how you live, one temperature is clearly not enough. You want to know how the temperature varies seasonally and where you live.
Also, climate models cover both a large area (the whole Earth) and a long time (decades), so they are expensive to run and require the biggest computers. And, they have to account for the various things that affect climate from the outside – the variability in the sun, the variation in greenhouse gases and particles, etc. By comparison, weather models are run for at most around 10 days or so. To make the runs doable, climate models work on points too far apart to really represent smaller-scale atmospheric motions (“weather”), smaller-scale regional effects (such as vegetation changes), and even terrain.
Some climate scientists have looked at regional climate changes by running weather-type (regional) models to describe what’s happening at the boundaries of a smaller area – such as the United States. (If the model only covers the United States, it still has to account for what the wind brings from the outside!) These models have taught us something. However, there is a worry that the climate models supplying the boundary information are themselves faulty because the effects of “weather” could affect the details of the local wind, temperature, etc.
So, in spite of the enormous costs, climate scientists are just now starting to run climate models on computers or clusters of computers working together that are powerful enough that global climate models can represent these regional changes better. The first such computer system was the Japanese Earth Simulator. It enabled model runs with grid points spaced at one-tenth the distance of most climate models. As more and more people start focusing on regional climate, and more computers with the capability of the Earth Simulator become available, the issues of our effect on Earth’s surface will be studied more intensely.
And our discussion didn’t even consider more long-term effects, such as the effect of land use on changes in greenhouse gas concentrations! Nor have we considered the effects of forests.
Reference: Raddatz, R.L., 2006. Evidence for the influence of agriculture on weather and climate through the transformation and management of vegetation: Illustrated by examples from the Canadian Prairies. Agricultural and Forest Meteorology, 142, 186-202.
