
As noted in previous blogs, many of us don’t understand the terms people use in describing climate change; nor do we always understand how ideas related to global climate change relate to everyday life. So I decided it would be useful to write about some of these common misconceptions or partial misconceptions. I’ll start with the misconceptions.
Misconception: The term “global warming” means the temperature is getting warmer everywhere. “Global warming” sounds to many (including me) like the temperature should be warming everywhere. If there is “global warming” shouldn’t it be getting warmer where I live? Or, if it’s not getting warmer where I live, how can “global warming” be happening!
If you look at the recent temperature records from several GLOBE schools, the temperature does seem to be warming gradually in some places. But other schools show a cooling trend. It is the same way with the stations used to monitor climate change. As noted in my July 2008 blog, the global average temperature change is often much less than the trends at local sites.
The term “global warming” really means that the yearly average of the temperature averaged over all the Earth’s surface is rising over time scales of several years.
Misconception: We just had a month that was the coldest on record. That means that the climate has started to cool again. When I stop thinking like a scientist, I also briefly think – or hope – that a cold month means that “global warming” will go away. But a record cold day or month doesn’t mean that the climate is getting cooler on the long term.
In a warming climate, there are still changes in both directions from day to day, month to month, and year to year. But there will be fewer record cold months. And there will be more periods of record high temperatures. For example, the city of Chicago in the Midwestern United States is having more heat waves, as illustrated by Figure 1 (taken from the blog, “Regional Climate Change, Part I: Iowa Dew Points and Chicago Heat Waves,” 22 March 2007).
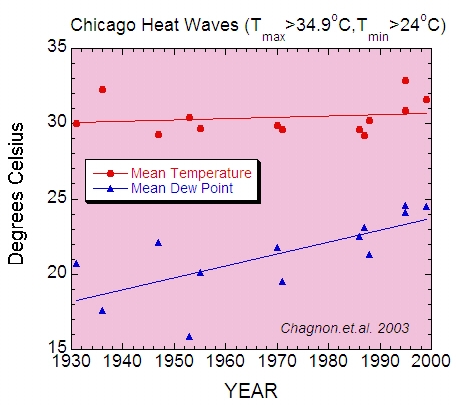
Figure 1. Temperatures during Chicago, Illinois, USA heat waves. While the graph was made to show how the dew point has risen during the heat waves, the increase of the number of points (heat waves) with time shows that there are more heat waves than there used to be. Figure based on data from Changnon et al. (Climate Research, 2003).
Misconception: Earth’s temperature will steadily warm (as in “This year is warmer than last year, and next year will be warmer than this year.”). The globally-averaged yearly temperature record in Figure 2 has many dips and peaks. It is well-known that strong El Nino events, through spreading warm water across the tropical Pacific, will cause peaks in the record (There were strong El Ninos for example in 1982-3 and 1997-8). Similarly, volcanic eruptions can cool the surface temperatures globally for a year or two.
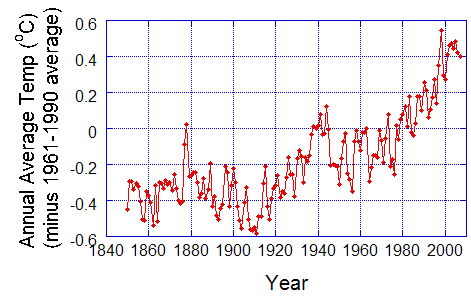
Figure 2. Annual average temperatures, averaged over the Earth. Data from the UK Hadley Centre.
There will be even more extreme year-to-year changes locally. Some regions will have colder-than-normal periods due to persistent airflow from the Polar Regions. At the same time, there will have to be compensating airflow toward the poles in other regions, which will have warmer-than-normal periods. If you look at any local temperature record, such is the one in Figure 3; there are year-to-year changes that are faster than the overall warming trend. Even though there is a general upward trend in temperature as indicated by the straight line, the warmest year on record was 2000. On the other hand, 1998 was the warmest year in Figure 2.
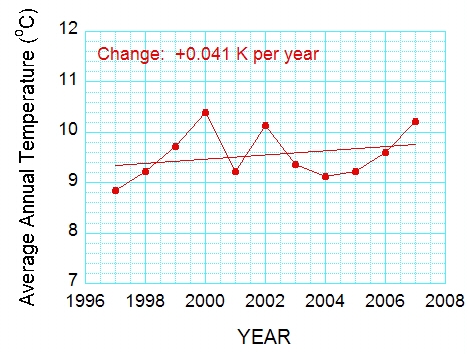
Figure 3. Average annual temperature at the GLOBE School 4. Zakladi Skola in Jicin, Czech Republic. From 15 July 2008 blog.
Misconception: The “warming” scientists write about is not real. Many thermometers are showing warmer temperatures because their surroundings have changed over time, and this affects the global average You can find web sites showing weather stations next to buildings, air-conditioning heat exhausts, and so on. So this is certainly true for some sites. However, climate scientists try very hard to eliminate such sites from the climate record. There are literally thousands of weather stations in the United States today, and a similar density of sites exist in other parts of the developed world. These are used for many things, such as weather forecasting, keeping track of weather at airports or along roads or railroad tracks, or for education and outreach purposes by television stations or schools. But only a small fraction of these are used to document the global change in temperature. It is important to know that the temperature at any station is not taken at face value. Each measurement is checked carefully. For example, each station is compared to nearby stations to see if their temperatures are biased or just plain wrong.
At the GLOBE Learning Expedition, we saw a climate-monitoring station, on a rocky hill at the southern tip of Africa, away from any urban influence (11 August 2008 blog). And, only 30 per cent of the Earth’s surface is covered by land – the other 70% of the area is over the ocean. There, ships, buoys, and now satellites supply the needed measurements.
This does not mean that the warming recorded by sites that were once rural but are now surrounded by cities is not telling us something. Cities are warmer than the surrounding rural areas. They have more concrete and asphalt, which means that more of the incoming solar radiation is converted to heat rather than used in photosynthesis or evaporation. Also, factories, buildings, cars, and even people release energy that warms the environment. If you move from a rural area to a city, you will experience a warmer climate. However, this “urban heat island” has only a small effect on the global average because cities cover only a small fraction of Earth’s surface (See “Land Use: How Important for Climate, 11 June 2008).
Also, we need to remember that the famous surface-temperature curve shown in Figure 2 is not the only evidence that the climate is getting warmer. Satellite data also indicate warming at and near Earth’s surface, as does the shrinking of most glaciers and the smaller extent and thickness of Arctic sea ice (see, e.g., http://svs.gsfc.nasa.gov/goto?3464) . Furthermore, sea level is rising slowly, a result of more water in the ocean basins (from the melting of ice on land) and expansion (as the water gets warmer). And there is more water vapor in the atmosphere than there used to be, consistent with more evaporation (to be expected from water land and sea surface temperatures as well as warmer air).