
(Note: We discuss carbon dioxide because it contributes to slightly over half of current greenhouse warming, but we must remember that methane, CFCs, ozone, and nitrous oxide together account with slightly less than half).
When I was a graduate student at the University of Washington, learning about weather and climate, I thought climate was boring, compared to tornadoes or thunderstorms. You averaged the temperature, rainfall, or wind, or – whatever – to get the climate of an area.
This changed around 1970, when I saw someone give a talk on the disturbing fact that the carbon dioxide in our atmosphere was increasing at a site on Mauna Loa in Hawaii. The speaker told us that he thought it was possible that this might make Earth’s climate warmer over time. (marked as “1″ on Figure 3). This was truly amazing! To me, the percentage of carbon dioxide was one of those numbers you memorized for class, like the conversion factor from Fahrenheit to Celsius. It was not supposed to change.
A few months later, another speaker said that the average global temperature, as far as he could see, would go down for a year or two after a volcanic eruption spewed dust into the stratosphere, and then warm up after the dust settled out. He didn’t think much else was happening.
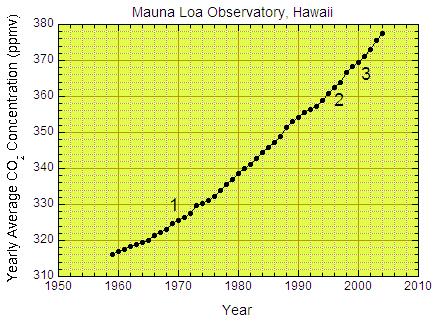
Figure 3. Yearly average carbon dioxide concentration collected at Mauna Loa Observatory, Hawaii, USA. Data from C.D. Keeling and T.P. Whorf, and the Carbon Dioxide Research Group, Scripps Institute of Oceanography. Ppmv = parts per million by volume. For example 300 ppmv means that out of 1,000,000 molecules in the mixture of gases we call air, 300 are carbon dioxide.
In the meantime, the carbon dioxide kept increasing. In 1997, I worked for the first time with scientists who were measuring how much carbon dioxide was going between the surface and the air at a site near Wichita, Kansas, USA. To take this measurement, we needed a reference value for carbon dioxide, and we used “360 ppmv” (parts per million by volume). From this graph, we were clearly behind – the mean value had already gone up to 364 ppmv. In 2002, we took similar measurements in the same area, and I was surprised to see how much the value had changed in only five years.
The amount of carbon dioxide in Earth’s atmosphere has changed a lot over geologic time.
- At the end of the Permian period (about 250 million years ago) scientists have estimated that carbon dioxide in the atmosphere was a high as 10 times what it is today.
- During the mid-Cretaceous period, the dinosaurs also lived in a “greenhouse” world. Again, scientists estimate carbon dioxide could be as high as ~10 times what it is today.
Geologic evidence supports a warmer climate in both cases, especially in Polar Regions. This has a lot to do with the large changes that take place when snow disappears.
As noted in your nicely written Changes 3 of this series, water vapor is the principal greenhouse gas. Without water vapor in the air, the oceans would be frozen.
The big unknown is the role of clouds and aerosols. Consider that while carbon dioxide has been steadily rising year after year, major northern hemispheric cooling occurred from the 1940s to the 1970s. A paper in the journal SCIENCE even predicted the possibility that increasing aerosols in the atmosphere might “…trigger an ice age!” (Rasool and Schneider, 1971.) Was the cooling caused by increased particulate matter from power plants, factories and forest fires? Did changes in cloud cover play a role?
This is where GLOBE can provide serious scientific data, for the gradual decline in particulate matter over various regions may result in a rise in temperature. Moreover, an increase in low cloud cover can cause cooling and an increase in high cloud cover can cause warming. GLOBE cloud observations and measurements of temperature, optical depth and column water vapor can provide vital clues about what’s happening to the climate.
Forrest M. Mims III
http://www.forrestmims.org
Hi Forrest,
Thank you for your comment. Yes — clouds and aerosols are big unknowns, and there is active work being done on both here at UCAR in the National Center for Atmospheric Research (NCAR), at NASA and other government labs, and in the universities. Not just with computer models, but with satellites (including the new Cloudsat and CALIPSO satellites), observations from aircraft, and from on the ground. The GLOBE sun photometer developed by you and David Brooks is still playing a part in this research — so students are playing a part, too.
Also, there is research that has shown that contrails have contribute to the mix. When the air is humid at jet level, contrails stick around, spread out, and if you watch long enough, turn into layers of clouds. GLOBE contrail observations are helping us to understand better what is going on there.
On a side note, it is ironic that you mentioned Steve Schneider’s work from the early 1970s. He was the “it is getting colder” NCAR person I was referring to in the last blog!
Best Wishes,
Peggy