Puddles and Soil Temperature, Part 2: Why is the water feeding the puddle not frozen?

This is the second in a series about an unusual winter puddle in Columbia, Missouri.

Recall from last time that I mentioned that the water feeding the puddle would be coming to the surface from under the ground – either a broken pipe or water flowing horizontally through the soil

In my recent 27 February blog about the air temperature and the surface temperature , I wrote about the “energy budget” of air about 1.5 meters above the surface (to explain why the maximum temperature was in the late afternoon), and I also wrote about the surface temperature, which reaches a maximum in the early afternoon.

To understand why the water feeding the puddle (and the surrounding soil) wasn’t frozen, we need to learn something about how temperature varies with depth beneath the surface.

The heating and cooling below ground is mostly by conduction. During the winter, the surface vegetation protects the soil from cooling, and upper soil layers protect the soil layers farther down.

For example, Figure 3 compares the air temperature and the temperature just 2 cm below the surface on a corn/soybean farm near Champaign, Illinois, USA (near Chicago). While the air temperature fluctuates quite a bit, the temperature at 2 centimeters below the surface changes much less. Particularly interesting is the cold weather between about 25 February and 5 March, when the soil temperature stayed warm in spite of the cold night-time temperatures. Figure 4 focuses more closely on that time period.

bondville-feb-march2002.JPG

Figures 3 For February and March 2002, air temperature and soil temperature (Ts) at 2 cm below the surface, a corn/soybean farm near Champaign, Illinois (Latitude 40.00621, Longitude -88.29041). Day 30 = 30 January; Day 60 – 1 March, Day 90 – 31 March). Data available on the Web at http://cdiac.ornl.gov/ftp/ameriflux/data/Level1/Sites_ByName/Bondville/FLUX-2002/.

bondvilledetail.JPG

Figure 4. For the 25 Feburary-6 March time period on Figure 5, Air temperature, surface temperature, and soil temperatures down to 64 cm below the ground.

Notice that the soil temperature gets warmer as you go down, illustrating the “insulation” effect of the higher layers of soil. From Figure 5, we see a similar pattern at Smileyberg, Kansas. On average, the soil temperature at Smileyberg was 1.9 degrees Celsius warmer than the air temperature in January, and 1.1 degrees warmer than the air temperature in February. Notice how the ground stayed warm between Days 24 and 32 (24 January and 1 February), in spite of the cold temperatures. This is just like the behavior we saw at the Bondville site.

smileyberg.JPG

Figure 5. For grassland site near Smileyberg in Southeast Kansas, the Air temperature (about 2 m) and soil temperature (average 0-5 cm). Data from Argonne National Laboratory, courtesy R.E. Coulter, Argonne National Laboratory.

Thus it is quite believable that there could be liquid water close to the surface, particularly since the air was much warmer the week before I got to Missouri. (Since I saw no frozen water on the surface uphill of the road, the water could have come up through cracks in the road.)

Posted in Atmosphere, Backyard Science, Hydrology, Soil | 2 Comments

Puddles and Soil Temperature, Part I: Liquid puddles on a cold winter day

Mostly written 21 February 2008, from Columbia, Missouri, USA

The temperature for the last few days has been below -5°C (about 20°F). The wind on my daily walks is cold but invigorating.

So, I was surprised yesterday when we drove over a puddle and water splashed on our windshield. It froze instantly. Given the air temperature, this is not surprising. The car thermometer read 17°F (-8°C).

How could there be water in a puddle after three days of subfreezing temperatures?

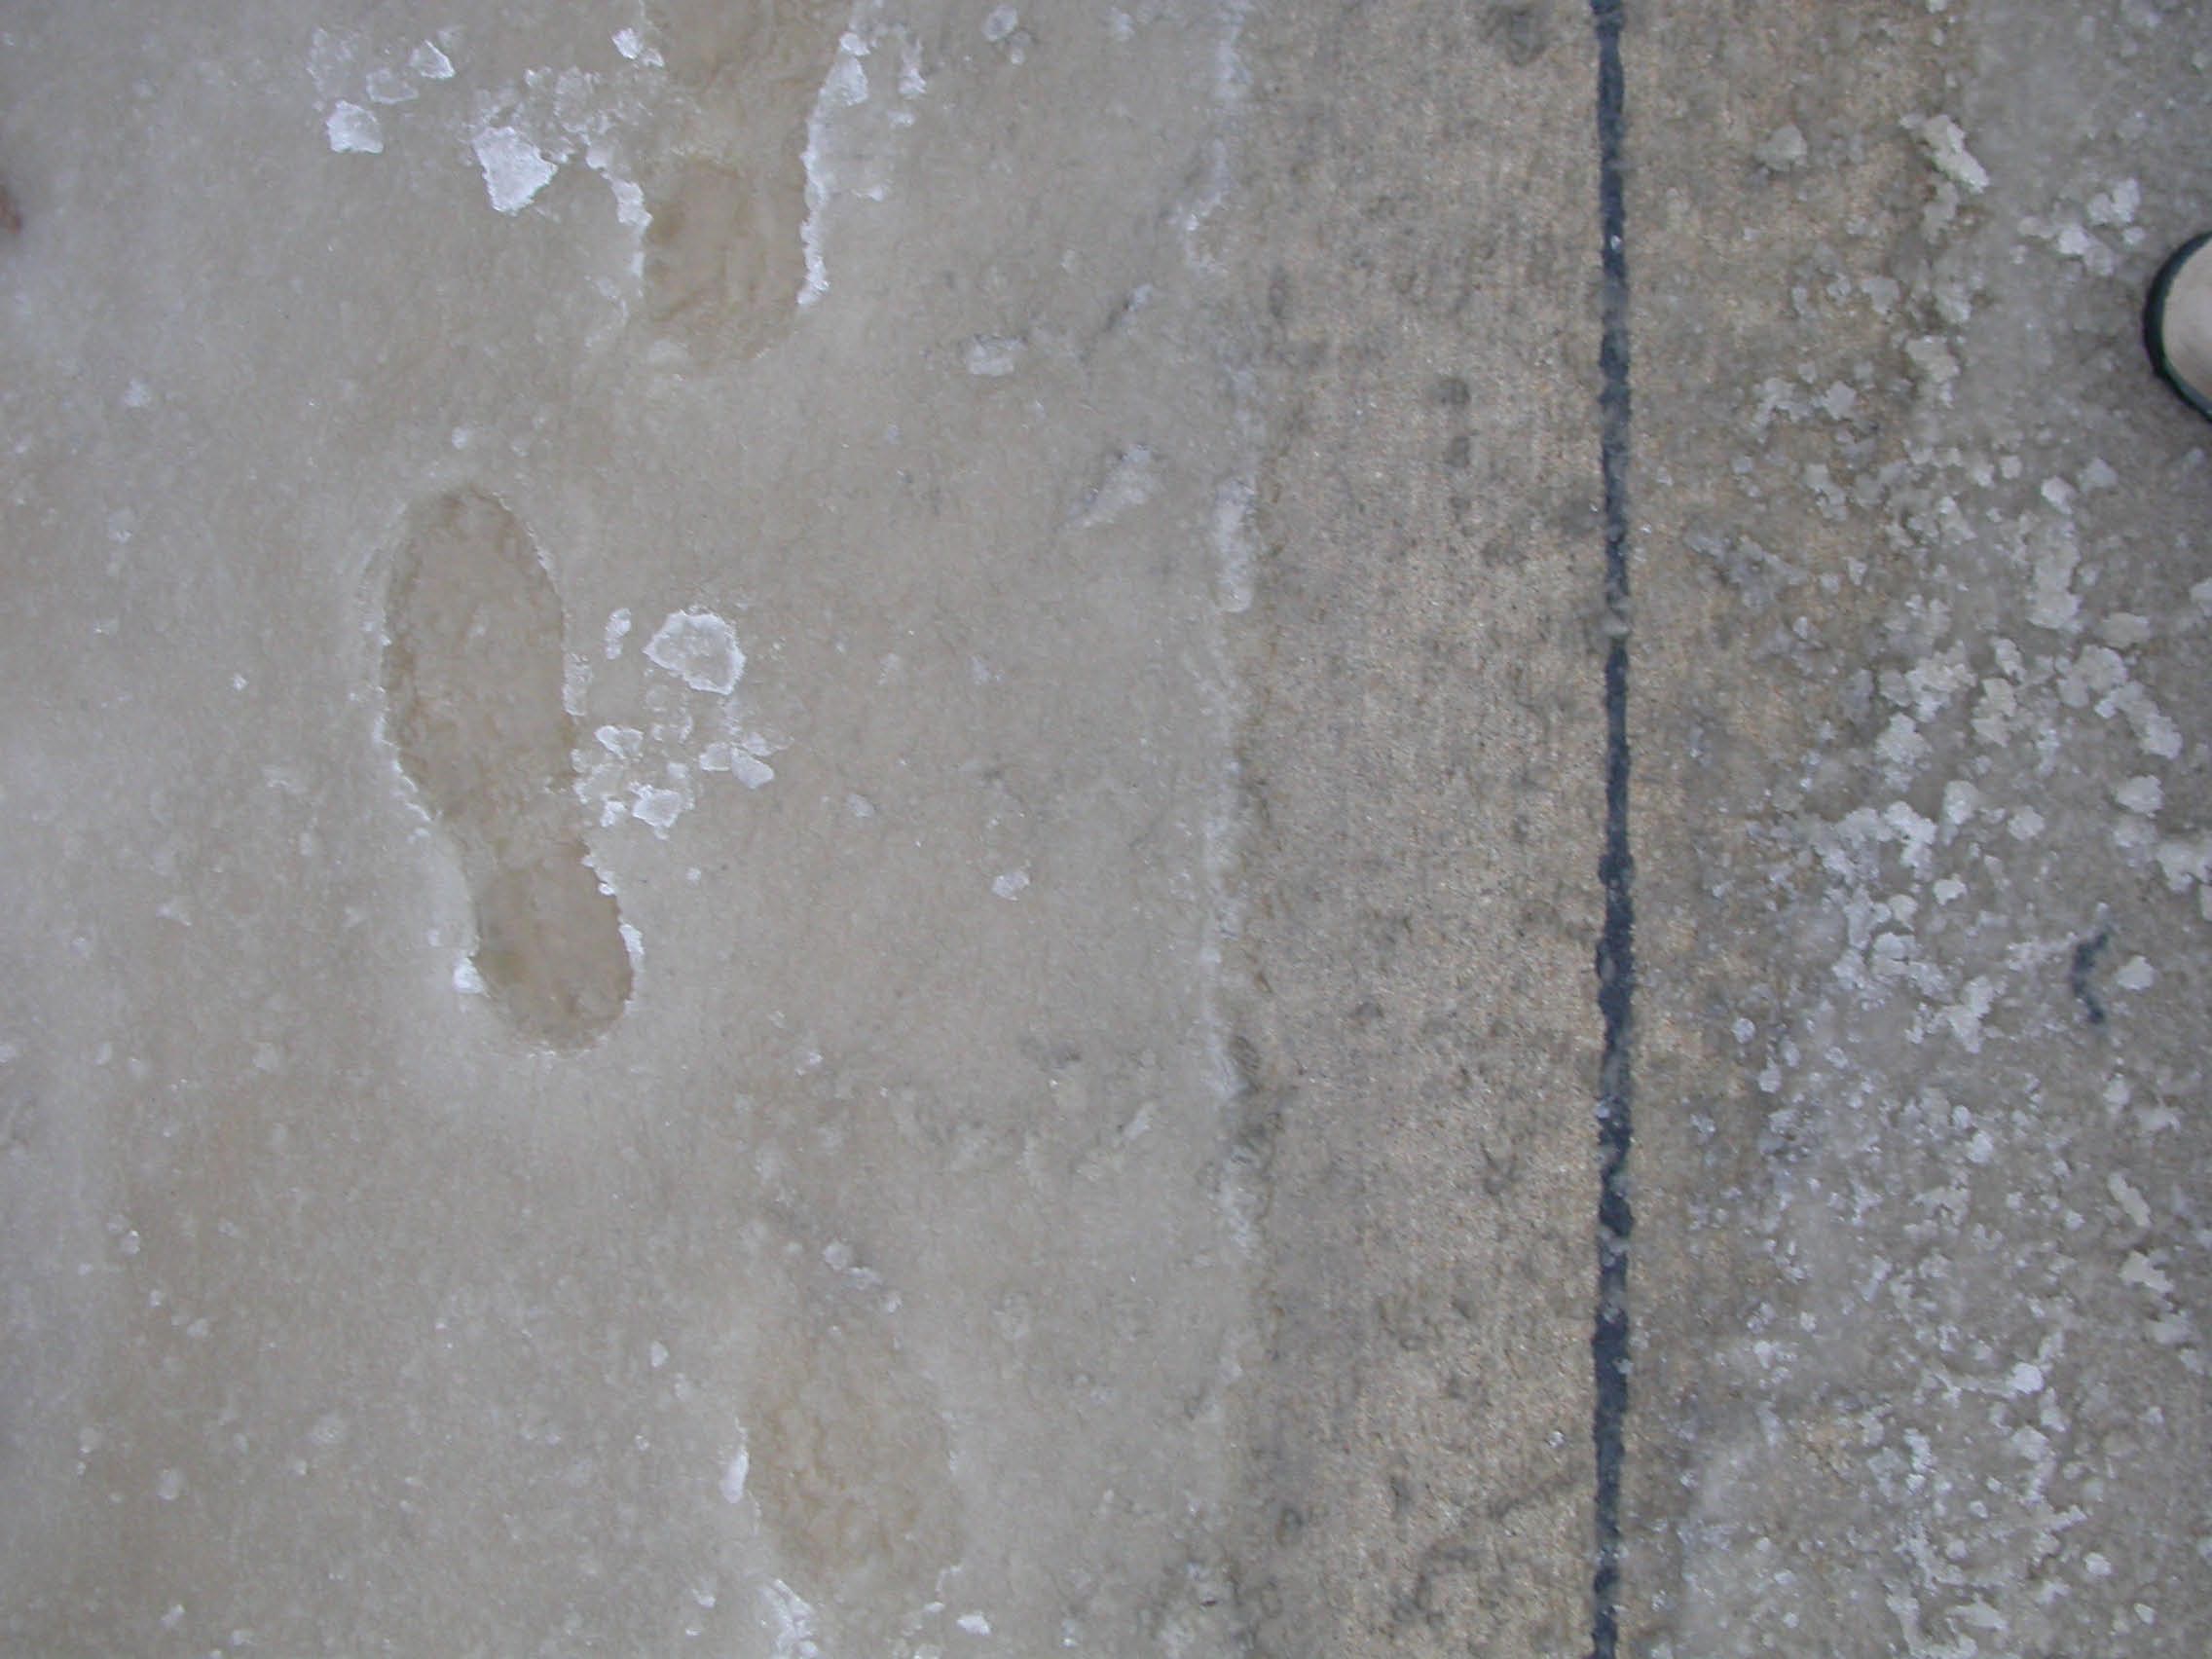
I decided to investigate on this morning’s walk, and found out a few interesting facts. Figures 1 and 2 show the puddle up close and from a distance. My footprints and the tire tracks in Figure 1 indicate that the puddle was “slushy.” It was easy to make footprints in it. So it is not surprising that passing cars were getting splashed when they drove over the puddle. The second picture shows the puddle with a fire hydrant on the north side of the road (and to the east of the puddle). A line of fire hydrants lies to the north of this road; so I conclude there is a pipe connecting them.

footprintstires.jpg

Figure 1. Slushy puddle with footprints (left) and tire track (right). At the time of the picture, the air temperature at this location had been below freezing for several days.

firehydrant2.JPG

Figure 2. Picture of puddle taken later in the day, after more frozen precipitation (ice pellets) covered the rest of the road with white. Note the red fire hydrant. The puddle is at a low point in the road, and the ground slopes downward toward the puddle from the north.

So, I came away with two hypotheses.

First hypothesis. The puddle is being fed from extremely wet soil. There has been a lot of precipitation around here recently. I knew this because I had been monitoring the weather the week before I got here. I am guessing that the soil is saturated and the water table is quite high.

So, the water could just be flowing downhill, perhaps atop the bedrock, which comes quite close to the surface. Or, the puddle could be fed by an underground spring. There are many springs in this part of the country. The bedrock, close to the surface, is Burlington limestone, which has multiple cracks and caves – paths for the water to follow.

Second hypothesis. The pipe connecting the fire hydrants just happened to have been broken here.

These two hypotheses are based on my impression that the puddle wasn’t there before 20 February. In either case, as we shall see, salt added on the road could have kept the water from freezing once it reached the surface.

I talked to my nephew, who was around when the road was built, and he supported the first hypothesis, because they found a lot of springs when they built the road. The springs are fairly active: my sister-in-law said that swimmers in a lake to the south of the road frequently noticed cool spots, where the cool spring water was feeding the lake. The springs also suggest that the water table is normally high. So, after an unusually wet period, it would be plausible that the water is running down the hillside beneath the surface.

Next time: Why wouldn’t the water running down the hillside beneath the surface be frozen?

Posted in Atmosphere, Backyard Science, Hydrology, Soil | Leave a comment

How the Temperature Varies During the Day and Night

When I was in school, I never seemed to have the right coat on. If I walked to school at 7:30 a.m. (0730) in my heavy coat, I would often be too hot on the way home at 3:30 p.m. (1530) On the other hand, it would be too cold in the morning to wear a lighter coat.

Now, as a trained meteorologist, I know the reasons why. Do you know what time of day it is the coldest? Or when it is the warmest?

Fortunately, it’s fairly easy to find some data to answer this question. On the GLOBE web site, you can find GLOBE ONE under “projects” and find data for 10 automatic weather stations from Black Hawk County, Iowa. Figure 1 shows how the temperature varied during five fair-weather days in April 2002, at Station 4.

2004april.JPG

Figure 1. Air temperature Tavg (red) and dew point Tdavg (blue) at a site in Black Hawk County, Iowa. Height: 1.5 m above the surface. The data are averages of five days with clear skies in April, 2004.

Looking at the graph, the highest temperature is at around 2230 UTC or 4:30 (1630) in the afternoon, local standard time. The lowest temperature is around 7 in the morning local standard time.

Did you expect the temperature to be warmest at noon, when the sun is highest in the sky? Many people do. Why doesn’t that happen?

Let’s start by considering the energy coming from the Sun. Between sunrise and sunset, the radiation from the Sun is continuously adding more energy to Earth’s surface. If this energy didn’t escape somehow, the temperature would be warmest at sunset.

We know this doesn’t happen. So, let’s take a closer look at what does happen. I’ll use data from southeastern Kansas.

ihop3031may.JPG

Figure 2. For two clear-sky days at a grassland site in southeastern Kansas, ground surface temperature and air temperature (top), downwelling (downward) solar radiation and net radiation (bottom). Notice how the net radiation goes to zero at about 19 hours past midnight and stays negative until about 5 hours past midnight. All times are local time.

In Figure 2, like Figure 1, the air temperature peaks late in the afternoon; at 16 hours past midnight (1600 or 4 p.m. local standard time) on May 30, and 16 hours past midnight on May 31 (40 minus 24 hours = 16 hours, 1600 or 4 p.m.).

We know the air at 1.5 meters is heated by radiation and convection.

The bottom of Figure 2 shows what is happening with the radiation. There is still energy coming in from the Sun at 4 p.m. (1600) and afterwards (until about 19.5 hours past midnight). However, the downwelling solar radiation isn’t the whole story.

Some of the solar energy is reflected back upward.

Also the air (greenhouse gases), clouds, and Earth’s surface radiate energy in the infrared. On the days represented in Figures 1 and 2, clouds of course are not a factor. Typically, the infrared radiation from the ground is greater than that from the air. The surface infrared radiation is what is measured by the instrument used in the GLOBE Surface Temperature Protocol: the instrument converts the infrared radiation from a surface (the grass, or asphalt, or bare ground) into a temperature. (For further information about the Surface Temperature see “Teacher’s Guide/Protocols” under “Teachers” in the drop-down menu.)

If you add up all the infrared radiation, the net infrared radiation is upward (upwelling).

The net radiation in Figure 2 is the incoming radiation (downwelling solar and infrared) minus the outgoing radiation (reflected solar and upwelling infrared). That is, the net radiation is downward between five hours past midnight (0500) and 19 hours past midnight (1900 or 7 p.m.).

I think I’ve convinced you (and myself) why the warmest air temperature isn’t when the sunlight is strongest. But why isn’t the warmest temperature at around 19 hours past midnight when the net radiation stops heating the ground and starts to go negative?

The reason is that heat is lost through convection.

Air currents carry heat away from the surface. Apparently, at 4 p.m. (1600) local time on both days in Figure 2, the incoming energy from the net radiation just balances the net outgoing energy from convection (convection brings up heat from the ground to 1.5 meters, but it also carries heat from 1.5 meters upward), and the air temperature reaches its maximum. Before 1600 (4 p.m.), the net radiation brings in more energy than convection currents remove, and the air temperature increases. After 1600 (4 p.m.), convection carries away more heat than the radiation is bringing in, and the temperature decreases.

Sometimes we call the adding up of incoming and outgoing heat a “heat budget,” because of the similarity to money. When you save more money than you spend, the amount of money in your bank account — or in your piggy bank — increases. If you spend more money than you save, the amount of money in your bank account or piggy bank gets smaller. When you spending as much as you are putting in, the amount of money stays the same.

What about the surface temperature? This is a little more complicated, because the ground is not only losing energy through convection currents, but it is also losing energy through evaporation and heating up the cooler soil below. These extra losses lead to the surface temperature dropping earlier in the day than the air temperature, around 14 hours past midnight.

At night, things are in some ways simpler. There is no sunlight. On clear nights with little wind, such as those illustrated in Figures 1 and 2, the air and ground keep cooling off by giving off infrared radiation (note that the net radiation at the bottom of Figure 2 is negative throughout the night). Since this continues all night, the coolest temperatures are in the early morning, near the time of sunrise.

Heat transport by air (convection) occurs when winds stir up the air near the surface. This complicates the situation. On average, convection tends to slow the temperature drop at 1.5 meters, with the minimum near sunrise.

Posted in Air Temperature, Atmosphere | 1 Comment

Weights and Measures

How do you compare two items? It’s easy if you have both of them to look at. If you have a series of tiles, like the one in the figure, you can see whether they are the same size by simply looking at them. They fit together, so they must be the same size. If the tiles are loose, you can find out whether they are the same size by placing them on top of each other.

figure-1.jpg

Figure 1. Nine-inch (about 13 centimeters) wooden tiles

Now, suppose you need to go to the store to get more tiles, and don’t have any extra to take along. Of course, you would measure the sides of the tile. When you measure it, you would find that the tile was nine inches (or about 13 centimeters) on a side. In the United States, where tile size is still measured in the English system, either “about 13 centimeters” or “nine inches” would be sufficient information to get you the tile you wanted – provided of course you had the right color, etc.

Having agreed-upon standards for measurements of length and volume has always been important for trade. If you need a liter of milk, you can go to the store and know that you are getting a liter. Before people had standard measurements, lengths and volumes were only rough approximations. In the English system, a “yard” was related to the size of a king’s waist, or the distance from his nose to the thumb on his outstretched arm. The cubit, as used in Ancient Egypt, was the length of a man’s forearm, and also related to the width of the palm of the hand or the width of a thumb. The “royal cubit” was 52.4 cm long. Other ancient peoples also used the cubit, but the length varied. For example, the royal Persian Cubit was 64.2 cm long.

For weights, early peoples would put stones on one side of a hand-held balance scale to measure the weight of whatever was being sold. Different sets of stones would be used for different items.

With such imprecise measurements, it was fairly easy for dishonest merchants to cheat their customers.

Even today, some measurements are surprisingly imprecise. The most extreme example I’ve come across is the size of women’s clothes in the United States. I have noticed for a number of years that my clothes size was getting smaller even though my actual size wasn’t.

I illustrate this with a story. About three years ago, when my husband and I went to see our daughter’s graduation from college, we stayed near the home of home one of America’s most famous woolen mills. In 1974, I had purchased a pair of their wool pants, which I loved. Since the cuffs were getting a bit frayed, I decided to take advantage of being near the mill to get another pair, as close to the first one as I could find. And I succeeded. They were exactly the same size except for a couple of details – the newer pants were slightly longer and the legs were narrower at the bottom.

figure-2.JPG

Figure 2. Wool pants purchased in 2004 (left) and 1974 (right). The tiles are nine inches (about 13 centimeters) on a side.

However, the new pants (left in the figure) are Size 6 and the old pants (right) are Size 12. I also purchased a jacket to go with the pants on both occasions. The new jacket is a Size 8; the old jacket is Size 14. And my weight hasn’t changed with time. I still wear both pairs of pants, and both jackets, and they all fit.

I have noticed this with clothing from other manufacturers, but only the recent experience allowed me to buy the same items of clothing from the same manufacturer. So it should not be a surprise that I never buy clothing without out first trying it on.

Can you speculate as to why these clothing measurements have changed? Could it be that the average weight of Americans continues to rise, so that what was once considered a medium size is now considered small?

So, you can see that the measurements of women’s clothing sizes in the United States can cause confusion. They are not “standardized” measurements. Today, there are standardized definitions of what a liter, meter, or temperature is. When you buy a liter or milk, or a meter of cloth, you know exactly how much you are getting. Measurements are really useful only when they mean the same thing to everyone.

Posted in General Science | 2 Comments

Watersheds Part 3

On the surface, we have something similar called “watersheds.” If the water isn’t soaking into the ground, hills act like our roofs, and the water flows on the surface until it hits a stream or river.

If you look at a stream, it is surrounded by higher ground. If you include all the ground that is feeding that stream, this area is the stream’s watershed. Let’s think a bit about what we know regarding watersheds:

  1. If the amount of precipitation is the same, more water flows out of bigger watersheds. Like bigger roofs shed more water.
  2. In big watersheds, it takes time for the water to flow out. Unlike our roof example, we cannot assume that the flow will be fastest when there is heavy rain upstream. In fact, it will take awhile for the rain to reach the outlet or mouth of the watershed.
  3. If the rain is light and the ground is dry, the ground might “soak up” the rain – and you might not see a change in the river or stream flowing out of its watershed. (This works in our roof example only if you are unfortunate enough to have a very leaky roof!).

Figure 4 shows an example of a watershed that I have studied. This is the Walnut River watershed, southeast of Wichita, Kansas. All the water falling on the area outlined flows into the Walnut River, which empties at the bottom of the picture.

figure4.JPG

Figure 4. The Walnut River watershed, which lies east of Wichita, Kansas, USA. Gray lines are contours; a red solid line outlines the watershed, and blue solid lines show the Walnut River and its tributaries.

This watershed measures 100 km from north to south, and about 60 km from east to west – a lot larger than the roofs.

A few years ago, scientists at Northern Illinois University and Argonne National Laboratory estimated the water budget of this watershed.

What does this mean? In simple terms:

All the water coming into the watershed = All the water going out of the watershed

It would be easy to do this if all you had to worry about was:

Rain falling in the watershed = Rain flowing out of the watershed

But it’s much more complicated, since

  1. The water might evaporate before it leaves the watershed, and
  2. Water will soak into the soil, and
  3. Water might flow deeper underground – that is, the watershed might “leak.”

In fact, all of these things happened in the Walnut River watershed. And these things can be complicated.For example, the amount of water evaporating or soaking into the soil changes with the surface. In Figure 5, grasslands are shown in green. Much of the area not colored is covered with crops (mostly winter wheat).

What would happen to rainfall in the late summer when the grass covers the ground but the winter wheat has been harvested? Do you think more water will run off the fields of harvested wheat? What about plowed fields?

figure5.gif

Figure 5. Contour map of the Walnut River watershed (outlined) with grasslands shaded in green.

Now think about the cities and towns. Figure 6 shows some of the larger towns in the same area.

figure-6u_l_walnut_river_ws.JPG

Figure 6. Map showing the upper (top) and lower (bottom) Walnut River watershed. Each small square is a mile (1.6 km) on a side.

Everywhere there is yellow, there is a city. The big yellow spot to the left (west) is Wichita. Much of Wichita is covered with concrete. Now think about what happens with a heavy rain? How much water would soak into the ground in Wichita, compared to the grassy areas farther to the east?

Now, think about the future. How much water would soak in if there were more cities, and the cities were bigger?

Clearly, what we do can affect the amount of water leaving the watershed.

Think about the watershed where you live. And watch for more about watersheds in the future: Visit the GLOBE Watershed Dynamics Earth System Science Project (ESSP) to find out more about this project and announcements for upcoming workshops. This project will be examining the flow of water through a watershed and how humans are impacting runoff and stream flow.

Posted in Hydrology, Land Cover, Watersheds | 2 Comments