This week we’ll continue our look at the climate summaries for each GLOBE region, with a focus on the Europe-Eurasia region. Recall that these annual reports provide a summary of the global climatic conditions and are a great benchmark for monitoring climate.
Regional reports provide a tremendous amount of information. The temperature and precipitation climate summaries are highlighted here, but if you are interested, more information about the Europe-Eurasia Region state of the climate is available from this website: http://www1.ncdc.noaa.gov/pub/data/cmb/bams-sotc/2010/bams-sotc-2010-chapter7-regional-climates-lo-rez.pdf
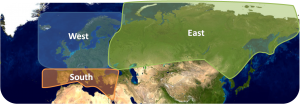
The GLOBE Europe-Eurasia region is interesting to examine, because not only is it such a large region, but portions are embedded within the Middle East and Asia regions defined by NOAA. The following image shows the three major sectors, west, south, and east, which will be discussed for Europe-Eurasia:
Like the Asia-Pacific region, the Europe-Eurasia region has many interesting features that require both temperature and precipitation to be examined. There are island countries, such as Malta, countries that are primarily desert, such as Israel, and countries that are highly mountainous, such as Austria. While these geographic conditions were also found in the Asia-Pacific region, what makes Europe-Eurasia different is the latitude in which these countries are found. For the majority of the region, these countries are considered to reside in the mid-latitudes, which see a wide variety of weather.
Let’s begin by examining temperature.
Temperature
The west sector includes the GLOBE countries of: Austria, Belgium, Croatia, Czech Republic, Denmark, Finland, France, Germany, Hungary, Iceland, Ireland, Liechtenstein, Luxembourg, the Netherlands, Norway, Poland, Serbia & Montenegro, Sweden, Switzerland, and the United Kingdom.
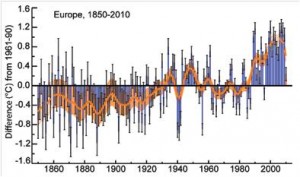
For this sector, NOAA put together a great image that shows the way temperature has been changing since 1850 (see Figure 1). It’s a bit complex, but the main thing that should be focused on is the orange line. The orange line is the departure of the annual temperature from an average value calculated from the base period (1961-1990). The data displayed on the graph is for the entire sector, not specific countries. At the end of the graph, you’ll see it’s a dashed line instead of solid. Why dashed? Because it all depends on what the base period is. In this case, the base period is 1961-1990, but it’s subject to change. You’ll notice that in the last couple of years, Europe has seen a decrease in temperatures. Even though it’s cooler than it was in the early 2000’s, 2010 was still above normal for this sector.
However, there were some countries that saw significantly cold years. 2010 was the coldest for Ireland since 1986, tied for the coldest for France since 1987, and was Germany’s first year colder than normal since 1997. The end of 2010 saw temperatures between -3 and -5 degrees Celsius for Germany and France, which was the coldest December in over 40 years, while in the United Kingdom, it was the coldest December in over 100 years.
The south sector includes the GLOBE countries of: Cyprus, Greece, Israel, Italy, Macedonia, Malta, Monaco, Portugal, Spain, and Turkey.
The Iberian Peninsula, which includes the countries of Portugal and Spain, was above average for 2010, although not too much above average, at only about 1 degree Celsius. The beginning of the year was slightly below average; however, temperatures were not nearly as cold as the west sector saw.
For the Mediterranean countries, temperatures were also warmer than normal. Turkey and Israel experienced the warmest years since the middle of the 20th century. An example of this warm weather, was on New Year’s Day, when Greece recorded the warmest January day in 50 years. This region was not without cold snaps, one being in Italy at the end of January. By the end of 2010, the Mediterranean countries saw vastly different patterns – with Italy seeing temperatures anomalies of -2 degrees Celsius, while Greece, Macedonia, and Turkey saw anomalies of +4 degrees Celsius.
The east sector includes the GLOBE countries of: Bulgaria, Estonia, Kazakhstan, Kyrgyz Republic, Latvia, Moldova, Romania, Russia, and Ukraine.
Like the south sector, the east sector saw warmer than average temperatures for 2010. The month of July was the warmest on record for Russia, even though the Urals and Western Siberia were colder than normal.
Precipitation
In the west sector, it was a tale of two areas. In the western portion of this sector, precipitation was slightly below average; in the eastern portion of the sector, it was near or above average. GLOBE students living in these areas may recall a few notable precipitation events in 2010. In February, a violent cyclone hit the coast, causing widespread power outages. Major flooding in August along the Neisse River in central Europe resulted in evacuations of more than 1400 residents of Poland and Germany. Finally, the onset of winter saw snow in the United Kingdom, and closed airports in Belgium, France, Germany, the Netherlands, and Switzerland.
In the south sector, annual precipitation was above average for the Iberian Peninsula. Spain saw an increase in precipitation of more than 50%, and Portugal saw its rainiest year since 2001. This trend continued into the Mediterranean area, where precipitation exceeded 125% of normal. One significant rain event occurred in Turkey from 13-14 October, where 123 mm of rain fell in Bursa. An event of this magnitude is said to occur once every 200 years.
In the east sector, there were no major departures from normal. This was not to say that the sector saw no extreme precipitation events. There were a few flooding events across the sector in the months of March and May due to snow-melt. In December, a freezing rain event halted operations at airports in Moscow.
With such Europe-Eurasia being such a large region, it is no surprise that there are major climatic differences. There is much more detail in the actual report summary: http://www1.ncdc.noaa.gov/pub/data/cmb/bams-sotc/climate-assessment-2010-lo-rez.pdf.
Does your record of GLOBE data for the past year show any similarities to the summary provided here? Have you had any significant events have you in your local area? Please share them with us through the comment option below!
Next week, we’ll continue on this journey through the GLOBE regions with a look at Latin America – Caribbean.


