Wow, it’s hot!

This week we have a guest post from Dr. Kevin Czajkowski.  Dr. Czajkowski has been lead of the University of Toledo GLOBE partnership since 2001.

It continues to be really hot in the central part of the US. The thermometer at our house says 98 F (37 C) today which is July 4, 2012. The number of 90 F (32 C) plus days this year has been high as well. There have been 8 days about 90 F (32 C) a my house in Temperance, MI so far this June and July. Toledo has had 12 days 90 F (32 C).

Last week I took some surface temperature observations using the GLOBE protocol for infrared thermometer. I measured the temperature of a parking lot with a cover of asphalt, a grassy area and an area with bare soil where the ground had been dug up. Which one do you think was the hottest? The grass was 34 C (94 F), the asphalt was 52 C (126 F) and the bare soil was 64 C (148 F). I didn’t expect the bare soil to be so hot.
NASA has produced a temperature anomaly image from satellite imagery (see below). The red shows areas where the temperature was above average and the blue shows temperatures below average for June 28, 2012. You can see that a large part of the US was red, above average.

Temperature anomaly image of the United States from satellite imagery

Temperature anomaly image of the United States from satellite imagery. From NASA

This heat has dried things out as well. I have been watering my garden every day. I really enjoy growing our own food. I knew it was dry because there was an area of the garden that the sprinkler missed watering. In that spot, even the weeds were dried up.

The Palmer Drought Severity Index in the image below shows that large parts of the United States are in drought right now. In fact, in northwest Ohio and southeast Michigan where I live, we have severe to extreme drought conditions.


Palmer Drought Severity Index from 26 June 2012

Palmer Drought Severity Index from 26 June 2012. From NOAA


Yesterday, a friend of mine posted on Facebook that he saw a fire in the forest near his house in Michigan. In this dry, hot weather, brush fires can easily start anywhere. He called 911 for the fire department to put it out. That was a wise thing to do. If you come upon a similar situation, tell an adult and/or call 911.
The fires in Colorado are related to this dry weather. The satellite image below from the MODIS sensor on the Terra satellite shows the current fires out west from NASA. Colorado has clouds over the mountains so the smoke from the fires is not visible.

MODIS satellite image of fires in the western United States

MODIS satellite image of fires in the western United States. From NASA

Why is it so hot? The upper atmosphere has been stuck in a pattern with a ridge over the center part of the US (see image below). This is a common summer time pattern with troughs over the western and eastern US. But, this summer it has been particularly persistent and hot. The troughs on the east and west coasts have kept those locations relatively cool. This image is the 500 mb map that is about 10 km (6 miles) above sea level. It is made by the National Weather Service using balloon observations at 0 UTM and 12 UTM.

500 mb map showing persistent ridging over the United States

500 mb map showing persistent ridging over the United States

Today was one of the hotter days that we have had in Toledo in a long time. The maximum temperature was 97 F (36 C). It is hot from the Rockies all the way to the east coast of the United States. On Sunday and Monday of this week, I was in Boulder, Colorado. The temperature reached 104 F (40 C) on Monday. What was interesting was that people were still out exercising or talking on the street. I had a really hard time believe that they could do it. But, to be honest, although it was hot, it did not seem oppressively hot. The reason was that the relative humidity was about 10%. The relative humidity is the ratio of the actual amount of water vapor in the air to the amount of water vapor the air can hold given its temperature. Warm air holds more water vapor than cold air with the amount increasing exponentially as temperatures get warmer. No wonder the relative humidity was so low. It was partly due to the temperature being so high and partly due to the low amount of water vapor in the air. Today in Toledo, the temperature was 95 F (35 C) but it felt much hotter. The relative humidity was about 40%. That means there was quite a bit of water vapor in the atmosphere. 40% relative humidity would still be considered pretty dry.

Below are the warnings on Friday, June 29, from the National Weather Service. You can see that there are large areas that are red in the image are heat warnings or fire warnings over large areas of the central US.

Watches and warnings for the United States from 29 June 2012

Watches and warnings for the United States from 29 June 2012. From NOAA

In Toledo, it is quite dry as well. The grass is all brown. In fact, the National Weather Service office has issued a fire warning for the area. This area is not known for its wildfires. You probably have heard by now of the devastating wild fires that are going on in Colorado. They have gotten worse since I came back.

The forecast is for the heat wave to continue. Stay cool. Stay in the shade if you are outside and drink lots of water. Heat stroke is very serious.

Dr. C

More information about Dr. Czajkowski: Dr. Czajkowski spent three years developing remote sensing research at the University of Maryland. Upon arrival at the University of Toledo, he established a research program in remote sensing and the Geographic Information Science and Applied Geographics (GISAG) Lab. His main areas of interest are remote sensing, climate change and K-12 outreach. His research includes the use of remote sensing to investigate water quality, i.e., assessing the source regions and destinations of contaminants in the Lake Erie watershed. He has developed a K-12 educational outreach program called Studnets and Teachers Exploring Local Landscapes to Investigate the Earth from Space (SATELLITES) that brings geospatial technology to K-12 students through teacher professional development and an annual student conference. He developed the surface temperature protocol through GLOBE so that students can investigate how land use where they live affects the energy budget. Each year he organizes the surface temperature field campaign.  Dr. Czajkowski is a blogger on his own, and this post comes from his blog, which you can find here.

Posted in Air Temperature, Backyard Science, Field Campaigns, General Science | 1 Comment

Climate Basics: What is the difference between weather and climate?

On any given day, if you use your favorite web browser to search for climate news, there would be countless articles that appear.  These talk about changes in temperature and what countries are doing to mitigate climate change. Similarly, if you search for weather news, another countless number of articles result, such as flooding, tornadoes or a heat wave.  They’re both talking about conditions of the atmosphere at a given location.  But what really is the difference?

Weather is the condition of the atmosphere over a short period of time.  A short period of time can be as short as 5 minutes in relation to a thunderstorm, to a week or even longer when experiencing a tropical cyclone.  Weather is always changing, and it’s what you look to when you’re planning outside activities and what to wear.

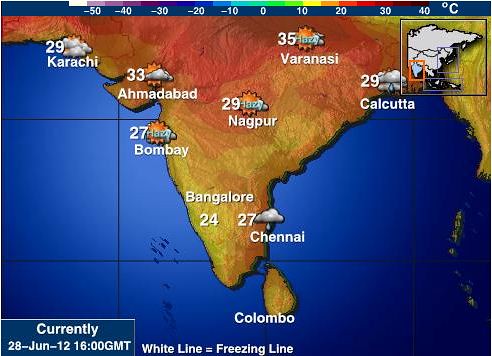
Current Weather conditions in India on 28 June 2012, from intellicast.com

Current Weather conditions in India on 28 June 2012, from intellicast.com

The GLOBE Program focuses on the collection of weather data through its atmosphere protocols.  These include, but are not limited to, air temperature, precipitation, relative humidity and clouds.  Data from these protocols that are entered into the GLOBE database are very important to  building a long term record.  As the record length increases, GLOBE schools will be able to study climate using GLOBE data.

Climate is the condition of the atmosphere over a long period of time.  A long period of time is generally defined as 30 years or longer by the World Meteorological Organization (WMO).  In order to determine a location’s climate, statistics are performed with the major atmospheric variables listed above.  These statistics take into account the latitude, terrain, altitude and proximity to water of a location.

As the GLOBE Program matures, GLOBE schools and scientists will be able to use data entered into the GLOBE database to examine changes in climate over time.  For example, if your school keeps a continuous air temperature record for 30 years at the same atmosphere site, you would be able to calculate the normal temperature for your specific school. A normal temperature is the temperature of a location calculated by taking the daily temperature and averaging it over 30 years.

An easy way to think about the difference between weather and climate is to think about your clothes closet.  Each day, you get up and choose an outfit, such as a school or work uniform.  That’s weather.  However, when you look at your wardrobe as a whole, you’re looking at climate.  As another example, take a look at this video from grist.com explaining variations (weather) and trends (climate) using a dog and his owner on a walk:

Understanding the difference between weather and climate is a key outcome of the GLOBE Student Climate Research Campaign (SCRC).  It aims to engage students in measuring, investigating, and understanding the climate system in their local community as well as around the world.  Using GLOBE protocols and data, as well as other long-term datasets, students take climate-related measurements and investigate research questions about climate.  Are you a school participating in the SCRC?  We’d love to hear from you!  Leave us a comment or email us at science@globe.gov.

-Jessica Mackaro

Posted in General Science | 1 Comment

Up in flames: high temperatures, low humidities and high winds make the perfect combination for wildfires

Each GLOBE region has been affected at one time or another by wildfires.  Last year, when we discussed the state of the climate for each region, there were mentions of wildfires specifically in the Africa region.  The fires referenced then were the result of dry lightning – a phenomenon where thunderstorms are elevated so far above the ground that precipitation evaporates before reaching the surface.  Cloud-to-ground lightning, however, continues to occur during these storms.  But it’s not just lightning from dry thunderstorms that can ignite these fires; they can be started by many things that include human influences.  Once they begin, weather conditions in the area are the biggest factor in mitigation.

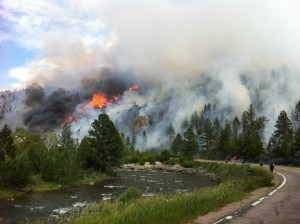
A look at the High Park fire burning along a creek near Ft. Collins, Colorado in June 2012.  Credit: Kerry Webster

A look at the High Park fire burning along a creek near Ft. Collins, Colorado in June 2012. Credit: Kerry Webster

Recently, the state of Colorado has seen a number of wildfires flare up.  What causes these fires is always a point of concern.  Was it a thunderstorm,  a campfire that continued to smolder, the butt of a discarded cigarette from a passing vehicle or the spark of a chainsaw of a worker trying to remove a beetle kill tree to prevent a fire?  Currently, there are eleven fires burning across the state, mostly in rural mountainous areas, but some have already destroyed homes and threatened more heavily populated areas, such as subdivisions on the outskirts of Ft. Collins, Colorado as well as in the city limits of Colorado Springs, Colorado.

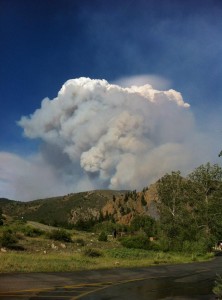
In addition to threatening communities, these fires can create their own weather systems.  Pyrocumulus clouds are often seen with very intense fires, such as firestorms, which are intense fire-driven wind systems.  Firestorms are formed as the fire takes in air from all sides, forming an updraft.  As the intake increases, the fire can grow even stronger as fresh air feeds it.  Sometimes if the updraft is strong enough, it can form a pyrocumulus cloud.  Sometimes these clouds can condense enough moisture that it falls as rain, helping to extinguish the fire.  Other times, the cloud may grow so large that it becomes a cumulonimbus, producing additional lightning and sparking other fires.

Pyrocumulus from the High Park fire in Colorado from June 2012 Credit: Kerry Webster

Pyrocumulus from the High Park fire in Colorado from June 2012 Credit: Kerry Webster

The High Park Fire, occurring outside of the city of Ft. Collins, Colorado, is the second largest fire in state history.  This specific fire was started by a thunderstorm that occurred in the early morning hours on 9 June 2012.  As of publishing time today, the fire had consumed 87,284 acres. This fire, consuming many beetle kill timber, has continued to burn due to persistent hot and dry weather.  Coupled with high winds, these three conditions make it easy for fire to spread and continue burning.  Why do hot, dry and windy conditions fuel fires?

Hot weather, in general, increases evaporation rates.  Evaporation is an essential part of the water cycle, driven by the sun. The sun heats the ground, which provides enough energy for water to transition from liquid state to vapor state.  If hot weather persists long enough without relief, evaporation can exceed precipitation, which results in dry conditions.  And if conditions stay dry for a long enough amount of time, plants die and become prime fuel for fires.  Add in the beetle kill, and you have an area of land with timber and dry grasses just waiting to ignite.  The final condition, high winds, is a fairly straight-forward condition: with high winds, sparks and embers are able to travel further than they would in calm conditions, allowing fires to grow quickly.

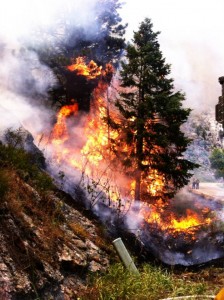
Close up of a tree on fire as part of the High Park Fire outside of Ft. Collins, CO in June 2012 Credit: Kerry Webster

Close up of a tree on fire as part of the High Park Fire outside of Ft. Collins, CO in June 2012 Credit: Kerry Webster

The GLOBE program has protocols to examine many aspects of fires.  In addition to atmosphere protocols that measure temperature and relative humidity, GLOBE has a fire fuel protocol that helps students measure the different types of fuels for fires.  Students are able to learn about the different types of living and dead organic materials that can become fuels for wild fires.  Through the use of this protocol, students can further understand fire behavior and effects, such as fire spread (how fast a fire moves) and fire intensity (the flame length).

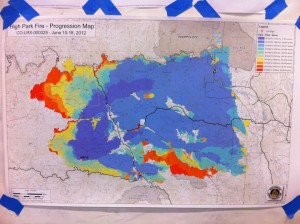
Progression of the High Park Fire, with red being most recent burn. Credit: Kerry Webster

Progression of the High Park Fire, with red being most recent burn. Credit: Kerry Webster

As summer continues in the northern hemisphere, fire awareness becomes even more important.  The State of Colorado has implemented a state wide fire burn ban; therefore no open flames are allowed until the ban is lifted.  But Colorado isn’t the only place experiencing fires.  Many states in the western United States are under fire watches, as the region experiences drastic precipitation deficits.  The need for rain is high, and the summer, typically a relatively dry season for the region, is only beginning.

Special thanks to Kerry Webster, a firefighter with the National Park Service in Boulder, Colorado for providing the photographs in this post.  Kerry has been actively fighting both the High Park Fire outside of Ft. Collins, Colorado as well as the Flagstaff Fire, which ignited on 26 June 2012 due to lightning in rural Boulder County, Colorado.

-Jessica Mackaro

Posted in Atmosphere, Backyard Science, General Science | 7 Comments

From drought to flood down under: Part III-Coping with the extremes

This week’s blogger is Neil Cliffe, from Agri-Science Queensland.  Neil is the manager of the Climate Risk and Adaptation Project in Queensland, Australia.  This blog post is part of a series on the extreme climate shifts that have been occurring in Australia; in which the region went from terrible drought (Part I-The need for rain) to devastating floods (Part II-When it rains, it pours).

Discussing climate change with people can sometimes be challenging. We all live in a world that is intimately influenced by the climate around us.  At a most basic level we experience variations season by season in variables such as temperature and precipitation.  This seasonal variation is more obvious in temperate regions of the world, but evident wherever we live, even in the tropics and sub-tropics.  Some of us have lived through extreme weather events that can have a profound impact on our lives, many of which are negative, but some of which have positive impacts too.  For example, we can think of the negative impact of extreme floods, but the positive impact that floods may bring to water supplies in dams and for agriculture production more generally.

Reconciling the climate we live in, which changes constantly, with the concept of climate change as a result of rising CO2 concentrations in our atmosphere can be a difficult concept to understand.  Views can be polarized by the different interpretations of data to fit one perspective or another, in addition to the role of the media in sensationalizing the issue for their own ends.  However, the majority of climate scientists agree that climate change is occurring and that atmospheric greenhouse gas concentrations, global temperature, and sea level are rising at rates that are unprecedented in the geological record.

How do we work with people who have different views and different knowledge bases to discuss this globally important issue?  In climate change adaptation workshops in Queensland, Australia, our goals are to raise awareness of climate variability and climate change projections at a regional level.  Then, we provide a structured discussion process, which challenges people to think about both the negative and positive impacts that a particular climate variable may have on an industry, community, or situation.  Finally, we consider what potential adaptation responses might be appropriate to respond to those impacts.

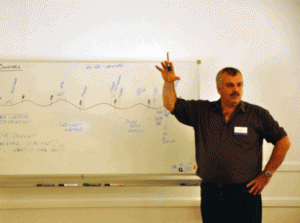
At the start of these workshops, we develop a 60-year timeline to collect group member’s experiences of climate and weather events that they have experienced in their lifetimes in the regions where they live.  Common examples that people provide include floods, droughts, heatwaves, fires, storms or cyclone/hurricanes.  We then challenge them to consider if they have noticed any trends in these events over their lifetimes.  This is a more challenging question and some people will say that there is no trend, it’s just natural climate variability.  However, others suggest that winters are getting warmer, the intensity of storms is greater, or that the pattern of afternoon storms in spring has changed in their lifetimes.  Others have noticed changes in biological systems.  For example, fishermen have noticed changes in the distribution and timing of catch for some fish species off the Queensland coast, with some species even disappearing in particular regions.

Neil leading timeline exercise discussion

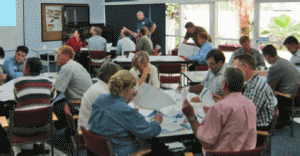
This ‘timeline’ exercise acknowledges local experience without judging perspectives that might be skeptical about the existence of climate change over and above natural climate variability.  In every workshop where we have used this technique, someone has identified a trend, or drawn a conclusion, that the outcome may be related to climate change.  In a sense, this then gives local permission to further discuss and consider regional climate records and what the science is saying in terms of regional climate change projections.  Thus, after this initial exercise we then share what the science says about climate in the region and go on to discuss in small groups the impacts and possible adaptation responses using a risk management approach.


Small groups discussing adaptation responses

From these workshops, I’ve come to believe that building understanding through recognizing local knowledge and experience, matched with the deeper insights that science provides, can lead to collaborative approaches that support people, industries, and communities to better respond to both natural climate variability and climate change impacts.

Suggested activity: How could you use the timeline exercise, as described in this post, in your classroom or community to encourage discussion on climate change?  Gathering experiential knowledge from people in your community using the timeline exercise to then compare with scientific data analysis would make an interesting research project to share with the GLOBE community!  We’d love to hear your thoughts—send us an email or post a comment!


Posted in General Science | 6 Comments

Thai Coral Reef and Climate Change

This week our blog is from Dr. Krisanadej Jaroensutasinee and Dr. Mullica Jaroensutasinee from the Centre of Excellence for Ecoinformatics at Walailak University in Thailand.  The research they are presenting in this blog is also done with Sirilak Chumkiew, Premrudee Noonsang and Uthai Kuhapong, also from the Centre of Excellence for Ecoinformatics at Walailak University and Dr. Elena Sparrow with the International Arctic Research Center at the University of Alaska, Fairbanks.

Climate change and increases in sea surface temperature (SSTs) are projected to be very likely in the coming decades. Combined with the acidifying effect of increasing dissolved carbon dioxide in the ocean, there is a clear research need to understand the likely impacts of climate change on marine ecosystems.

Coral reef ecosystems are sensitive to climate changes in the physical environment. Coral bleaching caused by unusually high sea temperature has had devastating and widespread effects worldwide. Numerous physical factors reduce the incidence of coral bleaching such as low light, high flow, lower temperature and higher nutrients. The link between physical conditions and the biological responses that lead to coral bleaching allows for the prediction of when corals may bleach based on measurements of the in-situ physical parameters. Monitoring of these parameters therefore becomes an important part of understanding and responding to coral bleaching events.

GLOBE Thailand, led by Dr. Pornpun Waithayangkoon (Thailand GLOBE country coordinator and IPST President), strongly supports the Thai Coral Project. GLOBE Thailand funds five GLOBE coral student research projects per year since 2009. Dr. Krisanadej Jaroensutasinee and Dr. Mullica Jaroensutasinee are the main scientists. Thai students will be using coral protocols, as well as some GLOBE hydrology protocols and atmosphere protocols, during their research investigation. Thai students have a chance to share their findings with SCUBAnauts International, led by Dr. Elizabeth Moses.

Students taking a photo(a)

(b)

(c)

Figure 1. GLOBE student training. (a) using underwater camera, (b) using some snorkels and (c) taking students to the coral reef site.

Coral database homepage (a)

Time series plot of sea surface temperature and salinity

(c)


Time series plot of sea surface temperature (b)

Website display of the "ecocam" webcam(d)

Figure 2. Coral Database System and data visualization. (a) Coral database Homepage, (b) sea surface temperature data (SST), (c) SST and salinity, and (d) ecocam.

We developed Thailand coral protocol and the Coral Database System (CDS). The CDS provides an essential tool for querying, analyzing and visualizing patterns of coral data in Thailand. The CDS prototype is available online. There were five study sites: (1) Racha Islands, (2) Phi Phi Island, (3) Hinpae and Ngamnoi Island, (4) Tan Island and (5) Sinmana farm. Each site contained different sensor data. Coral Database System was comprised of four types of sensor data: CTD, HOBO Pendant, weather Data, and ecocam. Users can visualize data and ecocam by selecting study sites and sensor types, time data collected and then visualizing the data. This database was designed to assist students and researchers who interested in long term monitoring of coral sensor data.

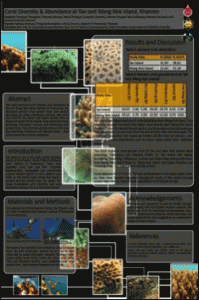
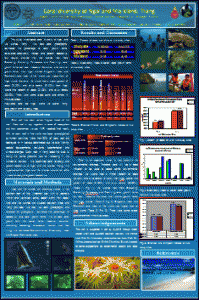
Example of coral project student poster presented at a GLOBE Learning Expedition Example of coral project student poster presented at a GLOBE Learning Expedition

Figure 3. Examples of coral project student posters presented at the GLOBE Learning Expedition.

Suggested Activity: Do you have coral reefs in your area?  Have you done any research connecting atmospheric and hydrological variables to coral ecosystem?  Send us an email at science@globe.gov or add a comment to let us know about your research!

Posted in Climate, Climate Change, General Science, SCUBAnauts | 6 Comments