Observing Birds

A series of guest blog entries by Dr. Kevin Czakjowski on the 2008 Surface Temperature Field Campaign will be interleaved with the regular Chief Scientist blogs. See the Introduction to the Surface Temperature Field Campaign.

I’ve often written about clouds on this blog. They are so easy to observe. Today I’m writing about birds since they are easy to observe as well.

It’s fun to watch birds. Many people spend their lives counting how many birds they have seen over their lifetime. I started doing this recently as well. But I find the more interesting part of my “life list” tends to be notes about what the birds are doing. For example, “We saw a half-dozen Yellow-Headed Blackbirds foraging on a lawn in the middle of a blizzard,” or “The fledgling Kestrels were learning how to fly under the watchful eye of both parents,” or, “At sunrise, we watched the Crows fly from the foothills to the west into town for a day of feeding.”

Although a pair of binoculars helps in watching those birds that are small or far away, you can see an amazing amount close up. This is particularly so for tamer ducks or geese. In the United States, we often see Mallards or Canada Geese (Figure 1). And many are not too afraid of people, so you can watch them without disturbing them too much.
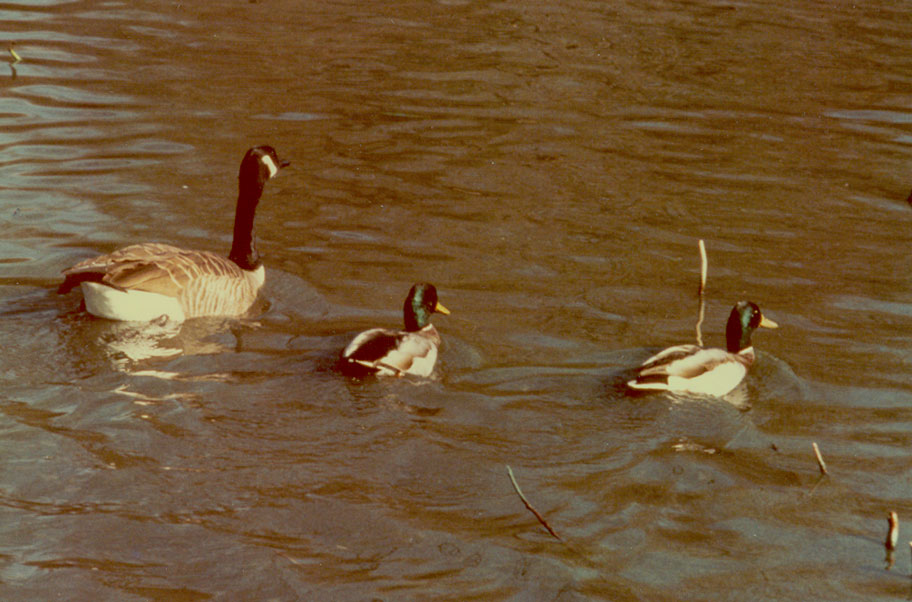
figure_1_canadasmallards.jpg

Figure 1. Male Mallards (right) swimming with a Canada Goose. Little Dixie Lake, Boone County, Missouri, U.S.A.

Mallards have an interesting way of feeding. Their front ends go under water and their back ends tip into the air. This is called “dabbling” (Figure 2). Mallards eat mostly plants – grains, seeds of some trees, bulrushes; but they also eat some animal matter as well, such as mollusks, insects, tadpoles, snails, and so on.
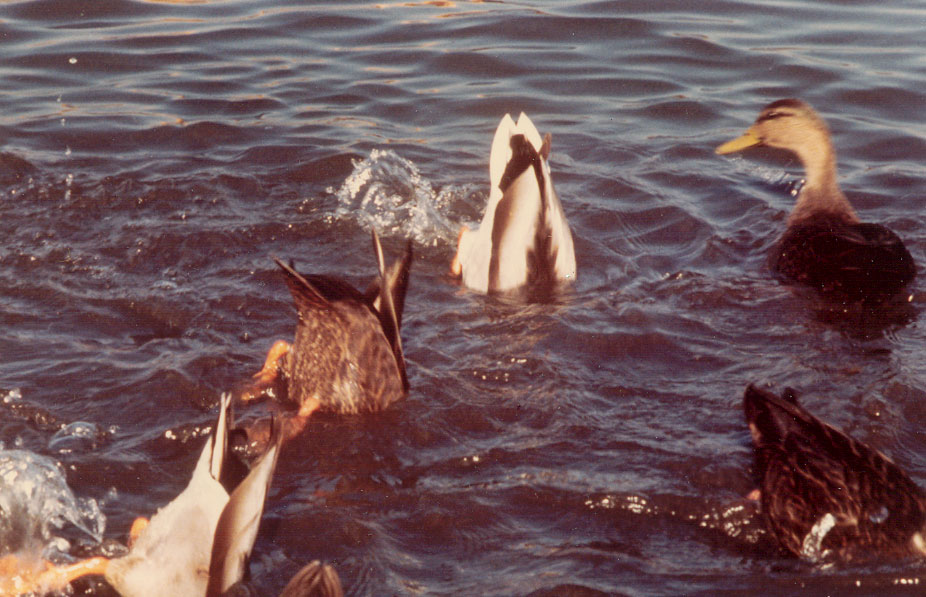
figure_2_dabbling.jpg

Figure 2. Dabbling Mallards. Also at Little Dixie Lake

Unlike watching clouds, you can “watch birds” without looking at them. When I was a teenager, I went birding with a blind man on the island of Oahu in Hawaii. He could tell what birds were around simply by their calls – and maybe a little bit from the noise the birds make as they move around, since some species sit in one place, and others flit around. He would describe to me what the bird looked like and point in the direction the sound came from. I met another birder who often observed birds from their sound. He starting doing this because he was a runner, and he didn’t want to have to stop and look. And knowing the bird sounds is useful when you simply can’t locate a bird hiding in a tree or bush. And you don’t need binoculars.

It’s important to stay far away from wild birds or their nests. During nesting seasons, many parks and nature reserves close nesting areas so that the birds can raise their young undisturbed. Also, you shouldn’t feed the birds in wild places. If you want to watch wild birds, you should keep your distance and use binoculars. Or watch them from a blind, or if you are lucky enough, through the window of your home or school.

Birds and the Seasons

The migration of birds in the spring and fall has thrilled people for centuries. In North America, we like to hear the honking of geese flying overhead during the spring and fall. The Canada Geese fly in large V-formations. This enables the geese to the rear to benefit from the air currents created by the geese in front. If you watch closely, you will see them change places once in a while.

Although you can enjoy birds any time of year, the best times to watch birds is in the spring, when the males are singing to attract mates. Each species has a different song, and the songs can vary from place to place. Or even, though less so, from bird to bird. At this time, it’s even more important to keep your distance and use binoculars to watch them.

Why do birds migrate? No one knows for sure, but it probably has to do with finding food and a safe place to make a nest. And this will vary, like migrations, with the type of bird. In the far north, for example, there are fewer predators that could survive through the harsh winters, so nesting there might be a bit safer for birds that nest on the ground during the summers. Insect-eating birds won’t want to spend much time in an area when the temperature is too cold for insects.

One interesting topic that scientists are studying now is how climate change affects bird populations. Many scientists have found that birds arrive earlier in the spring than they used to. Also, some birds are extending their ranges northward. In the GLOBE Seasons and Biomes/IPY Pole-to-Pole video conference (see March 2007 blog), one of the teachers noted that Magpies were reaching farther northward into Alaska, for example. Scientists continue to try to sort out the role of climate change in the changes of numbers of different types of birds. There are many other factors to consider, such as the number and type of predators, changes in land use, and the use of pesticides.

What birds are you seeing this season? Ask older members of your family if the types of birds are different now, or if their numbers have changed.

And, if you are interested in further information about observing hummingbirds, go to This Week at Hilton Pond.

Posted in Backyard Science, Climate Change, Seasons and Biomes | 2 Comments

Czajkowski’s 2008 Field Campaign – Introduction

This is the first blog about Dr. Kevin Czakjowski’s 2008 Surface Temperature Field Campaign. They will be interleaved with the Chief Scientist blogs, of which the current one is on watching birds.

Hi All,

I am very excited to be kicking off another GLOBE surface temperature field campaign. The field campaign will go from December 1, 2008 to December 19, 2008. Students are encouraged to take surface temperature observations of their local schoolyards.

Here are schools that have entered data so far in the field campaign:

The Morton Arboretum Youth Education Dept., Lisle, IL, US
Peebles High School, Peebles, OH, US
Kilingi-Nomme Gymnasium, Parnumaa, Estonia
Bellefontaine High School, Bellefontaine, OH, US
Oak Glen High School, New Cumberland, WV, US
Birchwood School, Cleveland, OH, US
The University of Toledo, Toledo, OH, US
Main Street School, Norwalk, OH, US

If you have entered data today and do not see your school’s name, do not worry. The database is updated each night. I expect that there will be many more schools involved this year.

Problems with Data Entry
I’ve looked over the data that has been submitted to GLOBE thus far. It looks like everyone is using Celsius. That is great. And, everyone is entering their snow depth in mm. Thanks. But…. A number of observations appear to have the incorrect Universal Time. It looks like a few of you saw your mistake and corrected it entering the new time of observation. This is critical. Entering the correct time is crucial to a good field campaign and having usable data. Don’t feel bad if you entered the wrong time though. I am having my graduate students in my remote sensing class observe surface temperature and enter data on the GLOBE website during the field campaign. I can tell that they entered the incorrect Universal Time the first time they entered their data. I’ll talk to them in class tomorrow about it.

This year’s theme is the International Polar Year associated with GLOBE’s Seasons and Biomes Project. We are hoping that as students gain an appreciation for the importance of the polar regions on the climate and that the students take the opportunity to learn more about the polar regions.

Alaska
It is really cold in Alaska today. Take a look at the temperatures in the figure below. The temperatures are in degrees Fahrenheit because that is the way surface weather data is displayed in the United States. Below you’ll see that the temperature in Fairbanks at 1623 UTC was –31º F (-35º C). That is really cold. The temperature in Fairbanks is colder than any temperature I have ever personally experienced. That cold air came over from Siberia in Russia. You’ll notice that at very cold temperatures, the Fahrenheit value and Celsius value are almost the same. What temperature are the Fahrenheit and Celsius temperature the same? I know that a couple schools in Alaska will be participating in the field campaign. It will be really interesting to see the temperatures the students report.

alaska.JPG

Figure 1. Weather observations in Alaska and surroundings.

The Forecast
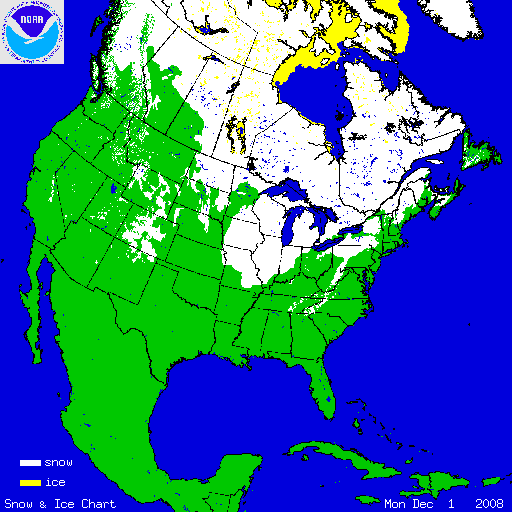
The forecast for the next week is for cold air to move out of Alaska and northern Canada down into the continental United States. The cold air in Alaska is due to a high pressure system. When the cold air starts to move out of Alaska, it will take on the characteristics of the new surface it is moving over. If there is snow on the ground over which the cold air is moving, the air mass will not change. Basically, the cold air stays cold. Snow on the ground helps to insulate the air from the ground. If there isn’t any snow on the ground, the ground will warm the air above it and it won’t be as cold. Looking at the snow cover map for North America below, you can see that most of Canada is covered with snow and there is quite a bit of snow in the Great Lakes region. Having this much snow in the Great Lakes region this early in December is somewhat unusual. There usually is not this much snow this early. Once the cold air comes out of Alaska, if the air travels over snow covered regions, the air will not change much and those areas will be very cold. This is something to look forward to if you like winter like I do. I can’t wait until it is cold enough to set up the ice rink in the back yard.

Many of you will be able to report snow on the ground when you take your surface temperature observations. Here are two questions that you can think about while take the measurements.
1) How does snow cover affect the temperature during the day?
2) How does snow cover affect the temperature at night?

cursnow_usa.gif

Figure 2. Current snow over North America.

I hope to see more and more data come into the GLOBE website!

Dr. C

Posted in Atmosphere, Field Campaigns, GLOBE Protocols | 1 Comment

Changes in carbon dioxide in the air

I’m going to write a little bit more about a “climate misconception” to follow up on the blog I did a few weeks ago. This relates to how our cutting back on carbon production affects the amount of carbon dioxide in the atmosphere. In the earlier blog, I stressed the long lifetime that carbon dioxide has in the atmosphere as being an important reason why it will take a long time to reduce the amount of carbon dioxide in our atmosphere.

But I missed an important misconception: many think that simply keeping the amount of carbon dioxide we release the same will keep the carbon dioxide in the atmosphere the same. Similarly, many think that reducing the amount of carbon dioxide we release will reduce the amount of carbon dioxide in the atmosphere.

As recently discussed in a recent article in Science, there is a fundamental misconception. We forget that the total amount of carbon dioxide in the atmosphere relates to how much we release and how much nature (or, if you prefer, the Earth system) can absorb.

The article describes a question asked of students at the Massachusetts Institute of Technology – a very smart bunch of people. The question went something like this:

Suppose we put twice as much carbon dioxide into the atmosphere as the earth system can absorb. How will the carbon dioxide in the atmosphere change if we keep producing the same amount of carbon dioxide?

A surprisingly large number thought that the carbon dioxide in the atmosphere would stay the same if we didn’t change our habits at all.

Does that seem right to you? Perhaps it does, because we have seen reports of increased amounts of carbon dioxide put into the atmosphere by humans, and an increase of carbon dioxide in the atmosphere. So we might be led to think that if we keep putting in the same amount of carbon dioxide, then the amount of carbon dioxide in the air will stay the same. And we can reduce the amount of carbon dioxide in the air simply by reducing the amount we put into the air.

But let’s stop and think a minute. The question states that the earth system can absorb just half of what we are putting in.

Suppose we have a bathtub. We turn on the water faucet full blast and leave the drain open, so that the amount of water going into the bathtub is twice what is draining out.

Do you think that the level of water in the bathtub will remain the same? Or are you worried that the bathtub will overflow?

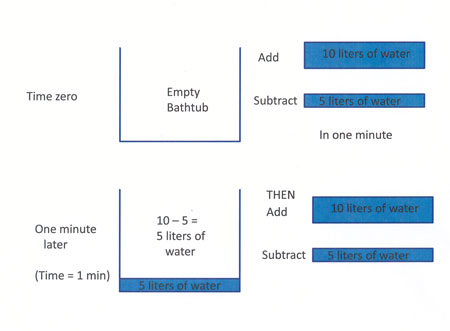
Let’s go through the bathtub problem step by step.

Start with an empty bathtub.

In one minute –10 liters of water comes out of the faucet, and we drain out five. (At least this is what happened when I did it.)

At the end of one minute, how much water is in the bathtub – five liters!

bathtub1.jpg

Figure 1. Putting water in a bathtub (well, a funny-looking bathtub) and draining it out.

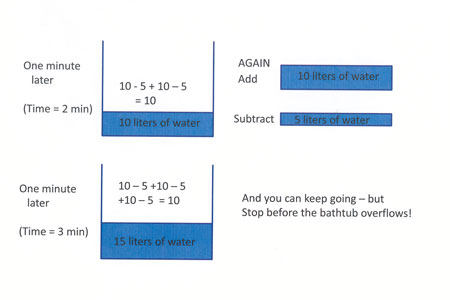
And the end of the second minute, another 10 liters of water has come out of the faucet, and five have drained out.

How much water is in the bathtub? Five liters, plus the ten liters from the faucet, minus five liters that drained out – that’s 10 liters.

bathtub2.jpg

Figure 2. Filling up the same bathtub, after two and three minutes.

At the end of the third minute, another 10 liters of water has come out of the faucet, and five have drained out. How much water is in the bathtub now? Ten liters already there, plus the ten liters from the faucet, minus five liters that drained out … 15 liters!

I could continue on, but I think you have the idea – the bathtub is filling at the rate of 5 liters a minute.

Now let’s go back to the carbon dioxide? What do you think now? If you think that the amount of carbon dioxide in the atmosphere will increase with time, even if we release the same amount into the atmosphere, you have the right answer!

Of course, our atmosphere (and people) are much more complicated than that. Different parts of the earth system – trees, grasses, the ocean – take carbon dioxide out of the atmosphere in different ways. And there could be other natural sources of carbon dioxide. We have a good idea about how things work, and what possibilities there are, but there is still much we don’t know. Thinking about the bathtub again, the drain might clog up a little bit or drain better, or water could be flowing from a second faucet.

This blog was inspired by the Policy Forum, by John D. Sterman in the 24 October 2008 issue of Science.

Posted in Carbon, Climate Change, Earth System Science | 1 Comment

Measuring Rain

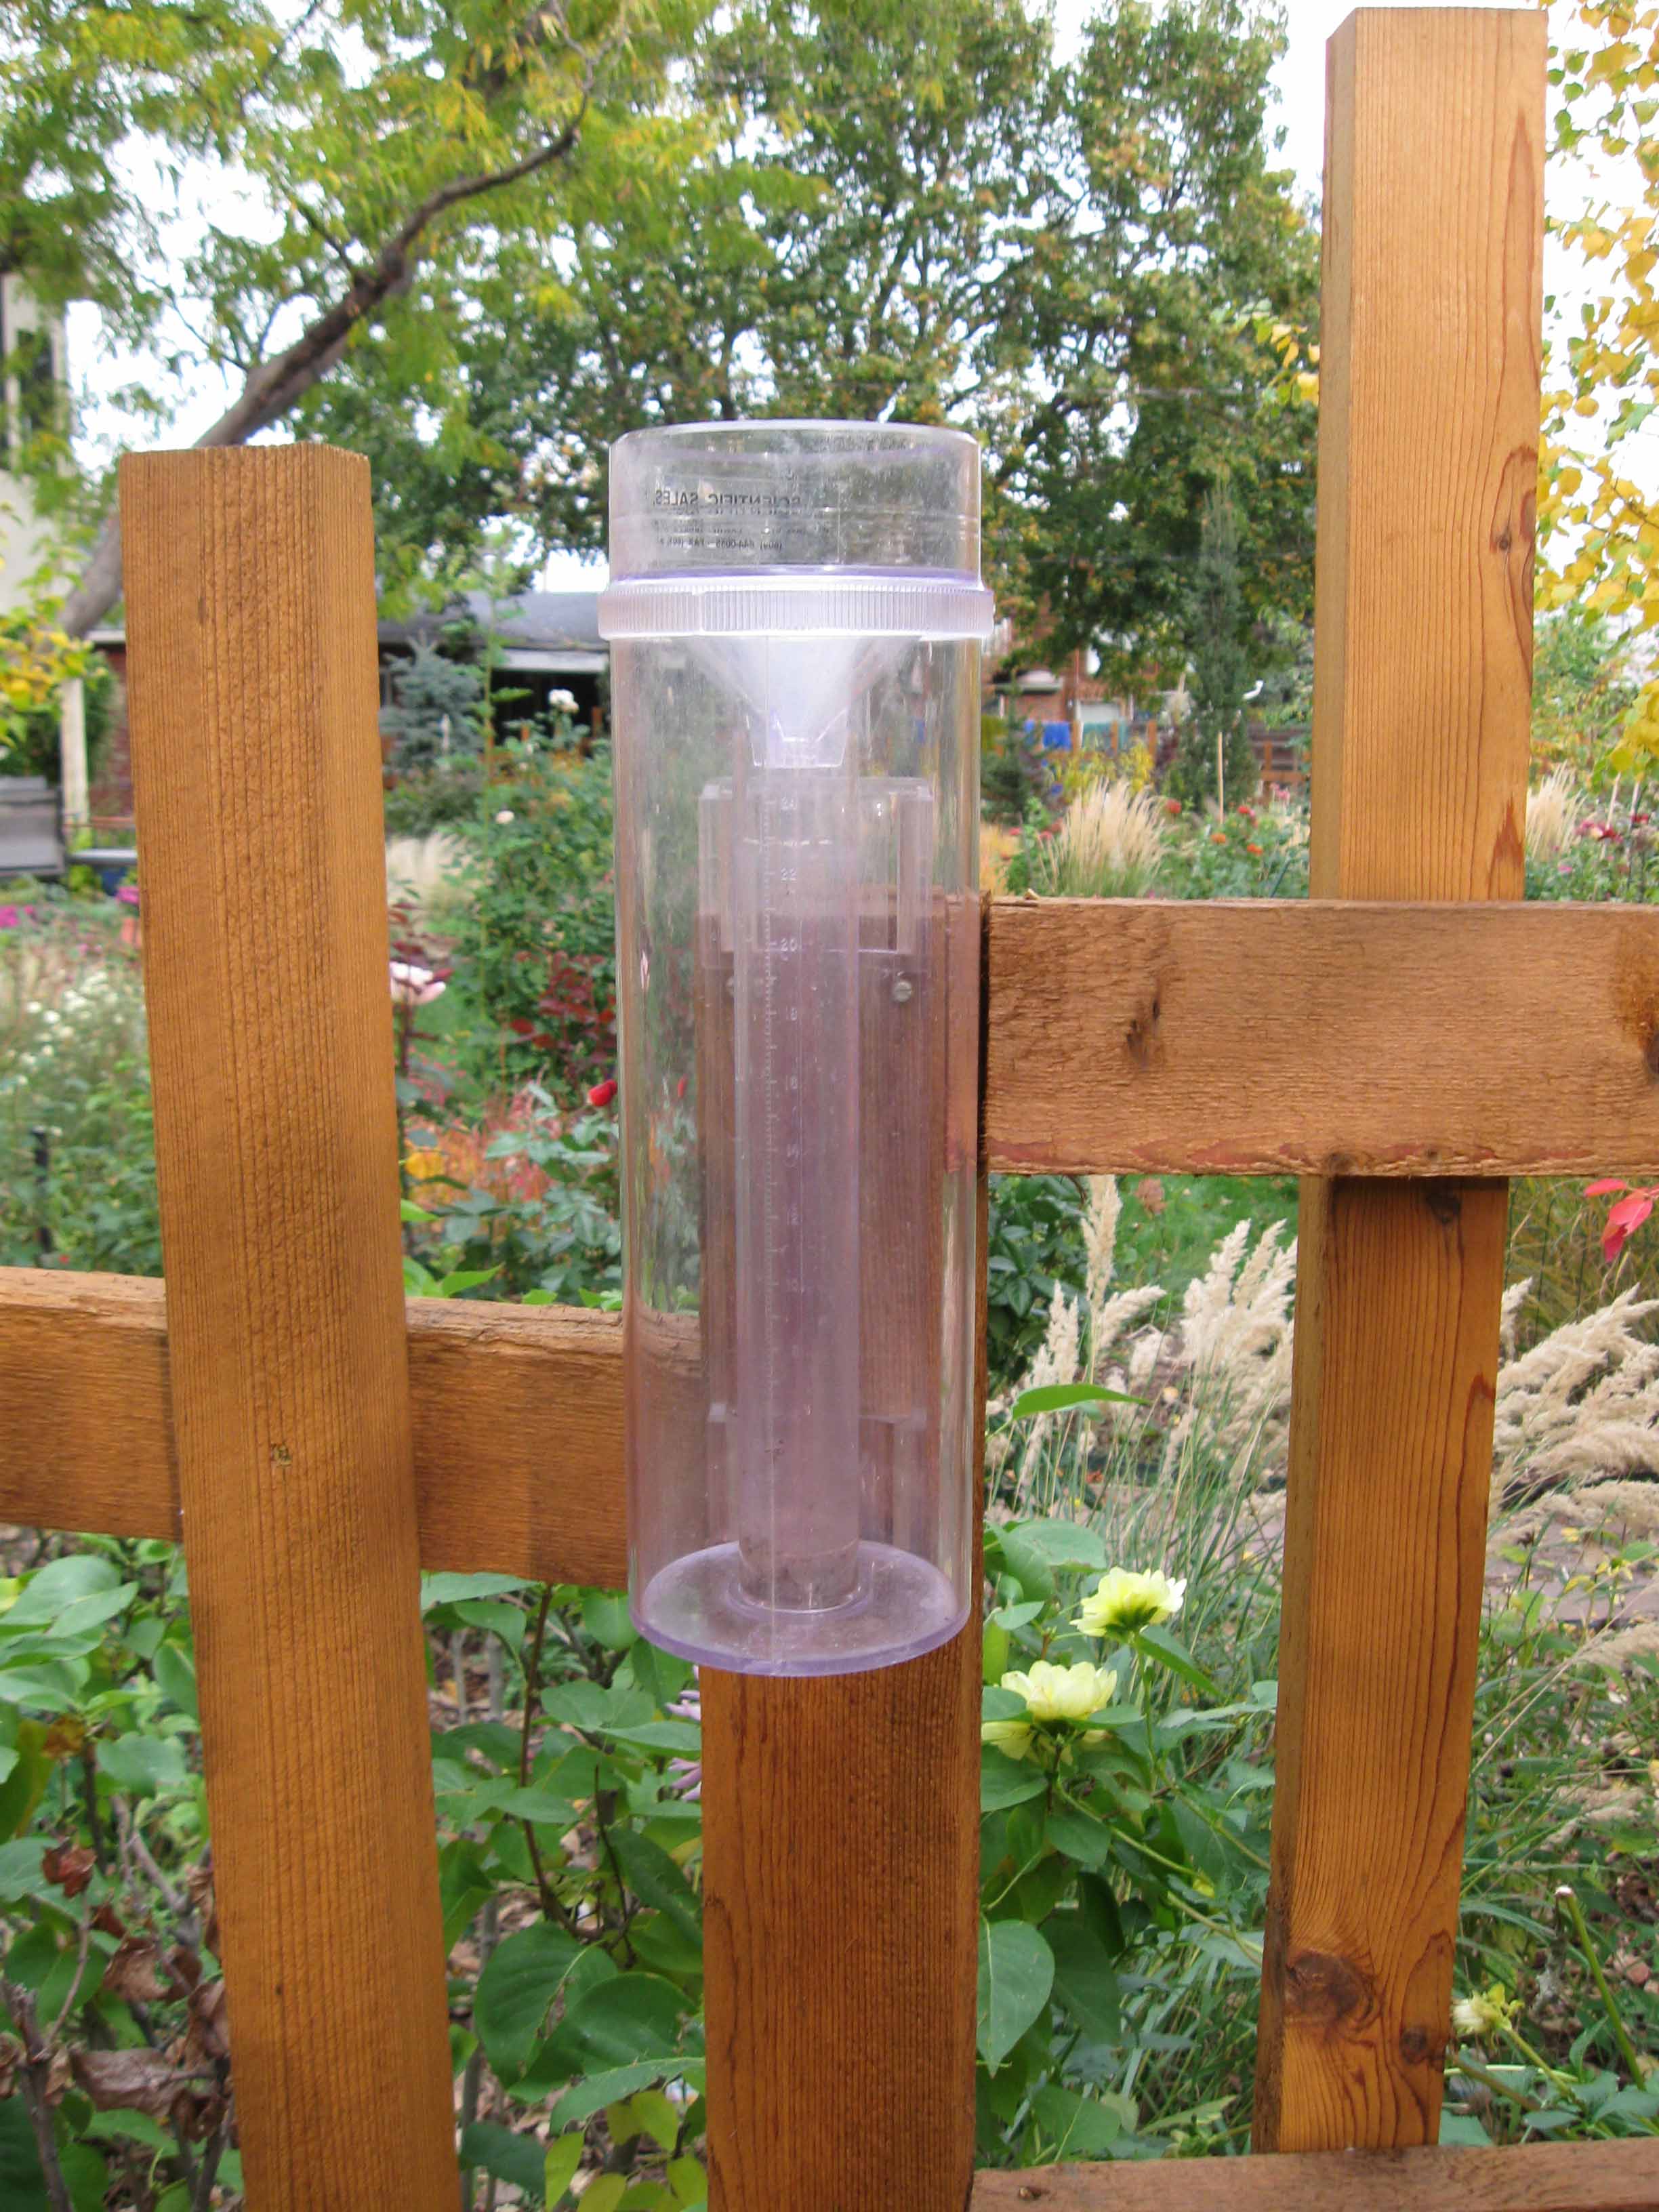
For years, I have been measuring the rain in our back yard using a standard rain gauge similar to the ones used by the U.S. National Weather Service (Figure 1). Like the gauge used by GLOBE students, rain goes through a funnel into a tube whose horizontal cross-sectional area is one-tenth that of the outer gauge, so that the measured rain is ten times the actual amount of rainfall. This year, I took a GLOBE-approved plastic gauge home. We put this one on a fence along the east side of our yard (Figure 2).

figure_1metal_gauge.JPG

Figure 1. Rain gauge used for observations in my backyard. Normally, there is a funnel and small tube inside, but it doesn’t fit very well, so we pour the rain into the small tube after each rain event. This gauge is similar to those used by the U.S. National Weather Service. This gauge is about 25 cm in diameter.

figure_2plastic_gage.jpg

Figure 2. Plastic raingauge matching GLOBE specs. This gauge is about 12 cm in diameter. Note the tall tree in the background.

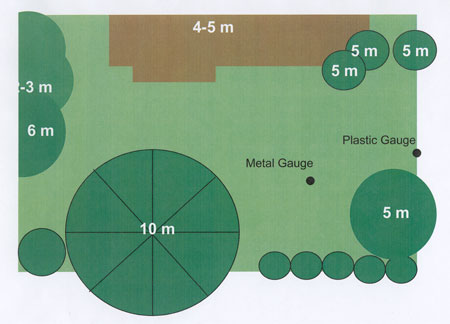
Neither gauge is in an ideal location. In both cases, there are nearby trees (Fig. 2, map) which might impact the measuring of the rain. This is a problem a lot of schools have: there is just no ideal place to put a rain gauge. We were particularly worried about the plastic gauge, which was closer to trees than the metal gauge.

Why do we have two gauges? The metal gauge was hard to use: its funnel didn’t fit easily into the gauge, so we had to pour the rain from the large gauge into the small tube after every rainfall event. We got the plastic gauge to replace the metal one. We put the gauge on the fence because it was well-secured. But the first six months we used the new gauge, the rainfall seemed too low compared to totals in other parts of Boulder. So, I put the metal gauge back outside and started comparing rainfall data.

figure_3backyard_map.jpg

Figure 3. Map of our backyard. Left to right (west to east), the yard is about 22 meters across. The brown rectangular shape is our house; the circles represent trees and bushes. The numbers denote the height of the trees and bushes. The 10-m tree is an evergreen; the remaining trees and bushes are deciduous. The southeast corner of the house is about 3 m high.

How did the gauges compare?

Starting this summer, I started taking data from both gauges. Unfortunately, it didn’t rain much. And sometimes, we were away from home: so this is not a complete record. But I don’t need a complete record to compare the rain gauges.

Table: Rain measurements from the two rain gauges

table.jpg

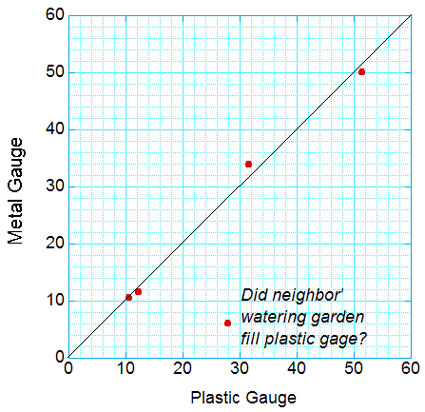
The results (in the table, also plotted in Figure 4) look pretty good. With the exception of the one “wild” point on 6 October 2008, the measurements are close to one another. We think that the plastic gauge was filled when the garden or lawn next door was watered. This would not be surprising: we have found rain in the plastic gauge when there was no rain at all.

I learned after writing this blog that Nolan Doeskin of CoCoRaHS (www.cocorahs.org) has compared these two types of gauges for 12 years, finding that the plastic gauge measures slightly more rain (1 cm out of 38 cm per year, or about 2.6%).

figure_4rain.jpg

Figure 4. Comparison of rainfall from the two rain gauges in our back yard. Points fall on the diagonal line for perfect agreement.

I learned two things from this exercise.

First, I probably should have used the two gauges before I stopped using the metal one. That way, my rainfall record wouldn’t be interrupted if the new gauge was totally wrong. (I was worried that the trees were keeping some rain from falling into the gauge. This would have led to the plastic gauge having less rainfall than the metal gauge. And, since the blockage by the trees would depend on wind direction and time of year, I wouldn’t have been able to simply add a correction to the readings.) Fortunately, the new and old gauges agreed.

In the same way, if you want to replace an old thermometer with a new one, it’s good to take measurements with both for awhile, preferably in the same shelter. Suppose the new thermometer gives higher temperatures than the old one. If you want to know the temperature trend, you can correct the temperatures for one of the two so that the readings are consistent.

The second thing I learned is that it is o.k. to reject data if there is a good reason (such as people watering their lawns). It’s also important to note things going wrong – like my spilling a little bit of water on 15 August. If you keep track of things going slightly wrong (or neighbors watering the lawn), you can often figure out why numbers don’t fit the pattern.

I will continue to compare records for awhile, to see whether the readings are close to one another on windy days. If they continue to be similar, I will be able to try a method to keep birds away from the rain gauge that was developed by a GLOBE teacher – Sister Shirley Boucher in Alabama. Keep posted!

Posted in Atmosphere, Backyard Science, Data included, General Science, GLOBE Protocols, Hydrology | Leave a comment

Comparing Fahrenheit and Celsius Temperatures

I try to write this blog to inform, rather than to express opinion, but I have to admit that I love the metric system. Perhaps it’s because I still remember how hard it was to learn how to convert things from one set of units to another in the British system we still follow here in the United States. Ounces to pounds, feet to yards to rods, square feet to square yards to acres. And so on. While in the metric system, it’s often simply a question of multiplying or dividing by 10, 100, and so on.

So, when my children were little, I taught them to think in metric, at least for some units. I succeeded with centimeters and inches, but kilometers and miles were harder, and temperature was the hardest of all. So today I’m writing about temperature.

In using the two sets of units, it’s useful to have some mileposts (kilometer-posts?). For example:

  • 0 degrees Celsius (or 32 degrees Fahrenheit), the temperature at which water freezes

and

  • 100 degrees Celsius (or 212 degrees Fahrenheit), the temperature at which water boils at sea-level pressure (about 1013 millibars).

But there are some other “kilometer-posts:”

  • – 40 degrees Celsius, where Fahrenheit and Celsius degrees are the same

And human body temperature:

  • 37 degrees Celsius or around 98.6 degrees Fahrenheit.

And “comfortable” room temperature:

  • 20 degrees Celsius or 68 degrees Fahrenheit

And, my favorite one:

  • 10 degrees Celsius (or 50 degrees Fahrenheit), above which insects become active.

Since this my favorite milepost and this might not be familiar to you, I’ll fill you in on some details.

When I did my cricket blog, I couldn’t get any data points below about 10 degrees Celsius, because the crickets weren’t chirping. You can see this from the graph in Figure 1. Well, that’s not quite true. The thermometer temperature showed below 10 degrees Celsius when I heard crickets once, but the cricket was “reporting” a temperature above 10 degrees Celsius with his chirps. Not really surprising — the temperature varies a lot from place to place at night, when you hear crickets chirp. In fact, before dawn on 6 October 2008 I heard a cricket when the thermometer temperature measured 46 degrees Fahrenheit (~8 degrees Celsius), but I didn’t count the chirps.

figure_1_fvsc.JPG

Figure 1. Using Crickets to estimate temperature. Notice the lack of data for temperature below 10 degrees Celsius. From cricket blog at http://www.globe.gov.

I knew about this temperature cut-off before observing crickets, from radar meteorologists. They see strong “clear-air” echoes when insects are flying. Figure 2 shows an example of insect echoes from a downward-looking radar used for research. The radar was mounted on a King-Air aircraft operated by the University of Wyoming. The data were collected while flying along a north-south track. So this is a north-south “picture” of insect plumes. It was 29 May 2002, and the air was quite warm — with temperatures well above 10 degrees Celsius.

figure_2may29_bright_band_smooth_v2.gif

Figure 2. Wyoming Cloud Radar image of “insect plumes” rising from the ground. 29 May 2002, on a north-south track over the Oklahoma panhandle (about 106 degrees West longitude). AGL means “above ground level.” Figure from Dr. Bart Geerts at the University of Wyoming.

Dr. Bart Geerts and his then graduate student Dr. Qun Miao found that the air was moving upward in the red and orange insect plumes, and that the air was moving down between them. They could see this because there were instruments on the King Air measuring the up-and-down air movement. I could feel the motion while I was on the plane: the airplane would get carried up when we crossed the “red” areas, and down in between. It was very “bumpy” where there were a lot of insect plumes.

You might think that the insects should be everywhere — after all, wouldn’t the insects be carried up by the upward-moving air and then back downward by the air between? Geerts and Miao found that the insects fly down in the updrafts, working hard to stay near the ground. This keeps the insects mainly in the rising air. Geerts and Miao even found that they could “measure” the updrafts and downdrafts by the radar alone by subtracting out the insect speed.

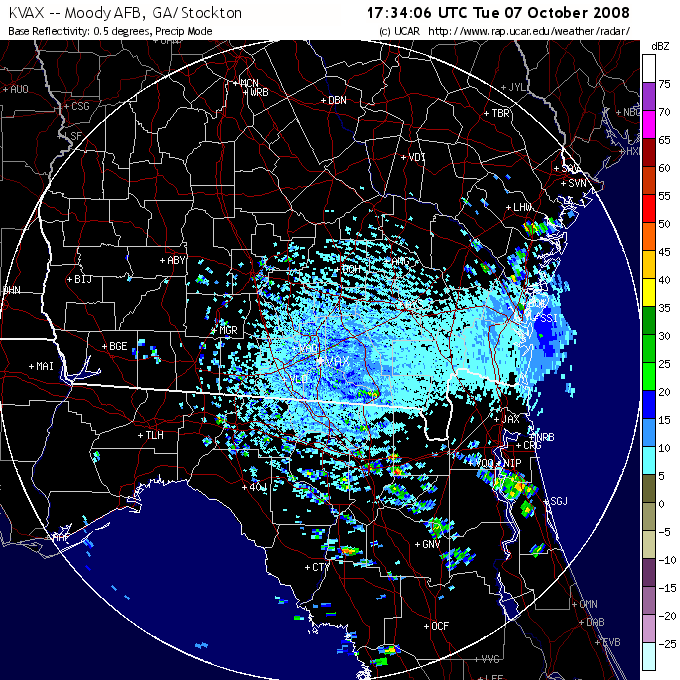
Here is another example of insect echoes, taken from weather radar in the southeast United States. The west-northwest to east-southeast-oriented light and darker blue patches are probably the “clear-air” (insect) echoes or small clouds; the yellows and reds are probably small rain showers.

fig_3_fvc_20081007_173406_black.png

Figure 3. Fair-weather echoes over southeast Georgia and Northern Florida in the SW United States.

Let’s summarize all these data in a table and a plot. First, the data. Plot this yourself, and see if you can think of any more “mileposts.” Or do some research to find some interesting temperatures, like the record high or record low temperature where you live. Or look at the FLEXE web site to see how hot it is near hydrothermal vents at the bottom of the ocean. You can use the graph to convert to the other units, or use the formula to convert back and forth (at the end of this blog).

Temperatures in Celsius and Fahrenheit

Degrees
Fahrenheit
Degrees
Celsius
Comments
-40.0 -40.0 Temperatures the same
32.0 0.0 Freezing point of water
50.0 10.0 Insects become active
68.0 20.0 Room temperature
98.6 37.0 Healthy human temperature measured by mouth
212.0 100.0 Boiling temperature for water at sea level pressure

figure-4_fvc.JPG

Figure 4. “Milestone” temperatures, in Fahrenheit and Celsius.

Methods of converting

You can use the table to make sure you are doing it right.

To convert Fahrenheit to Celsius:

Subtract 32 (notice you are subtracting Fahrenheit from Fahrenheit)
Then multiply by 5/9.

Or, if you prefer a formula, C = (F-32) x 5/9, where F is the Fahrenheit temperature and C is the Celsius temperature.

To convert Celsius to Fahrenheit:

Multiply by 1.8
Add 32
Or, in a formula: F = 1.8C + 32

Posted in Air Temperature, Atmosphere, General Science | 2 Comments