Observing Birds – Part 2


After the first of the year, when school is starting again in the U.S., I will write something about surface temperature measurements. Now, since many are out of school and have time to spend outside, it seemed like good timing to post a second blog about birds.

In my last blog, I mentioned observing birds from a blind. What is a blind? It’s a structure that keeps the birds from seeing you. Usually, it’s made up of three walls and a roof, like the one I visit frequently here in Boulder (Figure 1). Blinds are built near places where you would expect birds. For example, there are often blinds near lakes, so that you can watch ducks. One nice thing about observing bird this way is that you can see them really well (you have to be very quiet, so you don’t scare the birds away), and you can photograph them. With the new electronic cameras, it doesn’t take much money to get and print nice pictures of birds.

figure1a_blind.JPG

Figure 1a. Blind at Sawhill Ponds, Boulder.

figure1b_blind.JPG

Figure 1b. View through one of the windows inside the blind.

Last week, we were birding at Palo Duro Canyon (marked by the + sign), which lies southeast of Amarillo, Texas (See Map in Figure 2).

figure_2_palo_duro.JPG

Figure 2. Map showing Palo Duro Canyon, in the Texas Panhandle.

When we paid for going into the park, we were told that there was a blind near the Trading Post, where we could watch the birds. Of course there were many trails to walk on as well, but the blind was special, because we could watch the birds without disturbing them.

Here, the blind was near two bird feeders and an artificial stream where the birds could bathe. There was also a lot of nearby brush so that the birds had a place to escape to if they were frightened. For the humans, there are often benches to sit on inside the blind.

Here are some birds that we saw from the blind.

figure_3_fox_sparrow.JPG

Figure 3. Fox Sparrow. This bird is about 18 cm long.

figure_4_cardinal.JPG

Figure 4. Northern Cardinal (22 cm long)

figure_5_goldfinch.JPG

Figure 5. Goldfinch (13 cm long)

figure_6_pine_siskin.JPG

Figure 6. Pine Siskin (13 cm long) busily feeding.

figure_7_white_crowned_sparrow.JPG

Figure 7. White crowned sparrows

These pictures were taken with an ordinary digital camera with a zoom lens. Notice the brush in the background. You can take pictures, too – but avoid using your flash bulb. That will startle the birds. If it is too dark to get pictures without a flash bulb, just enjoy the birds and come back another day to take pictures.

It was fun to watch the birds interact with one another or with other animals. The Cardinal would chase the Goldfinches and Pine Siskins away. They would wait in the bushes until the Cardinal flew away, and then come back in and eat some more. This morning there were several Sparrows (I think) at our feeder here in Boulder this morning. They would take turns eating thistle seed – until a squirrel frightened them away.

Of course we saw birds while hiking at Palo Duro Canyon, but it’s hard to get close enough to photograph them without scaring them away – and we didn’t want to do that. But there was one kind of bird big enough to photograph from a distance – the Wild Turkey (Figure 8). Figure 8 is a bit blurrier than the others because it was taken in dim light and I didn’t have a tripod.
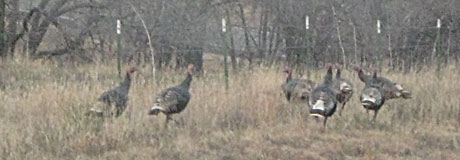
figure_8_wildturkeys.jpg

Figure 8. Wild Turkeys (Males are 46 cm long; females 37 cm.)

How do I know what birds these are? Some I learned a long time ago. But when I see a new bird, I look at a field guide with pictures of birds. Or I take notes on what the bird looks like and the way the bird behaves. Is it wagging its tail? Does it fly around a lot? Does it feed on the ground? Does it like to be high up in the trees? How big is it (it helps to have other birds you know nearby for scale, but this doesn’t always happen). Does it eat berries? What is the shape of its bill? Then, when I get home, I can either look at a bird book or find information about the birds on the Web. For a really nice introduction to identifying birds, a very helpful site is All About Birds, and of course there is some really nice information on hummingbirds at the Operation Rubythroat website.

You can have a “blind” at home. Look for a place for a bird feeder outside a window. If there are trees or bushes nearby, the birds have a place to go if they get startled. Look on the web (including the web site sited last time) for how you can make your yard comfortable for birds.

Once you know a few common birds for your area, you can watch for their arrival in the spring or fall. Common birds are probably easiest to use to indicate seasons, since your chances of seeing them are better. In the meantime, enjoy the winter birds!

Posted in Backyard Science | Leave a comment

Dr. C.’s GLOBE Surface Temperature blog 12-16-08

By taking your measurements for Dr. C., you are participating in science. Lots of scientists take measurements of different kinds to test new ideas, or to figure out how to measure things in new ways, like, for example, using a satellite instead of taking measurements everywhere on the ground. (You need to compare the new measurement with an old one that you trust.). Scientists analyze the data, and then they present the results at conferences like the one described below, and write articles about the results in scientific journals. When scientists write articles, the journals send the papers to other scientists for their opinions and suggestions before the article is ever published. These comments, and the comments from colleagues at conferences like this one for American Geophysical Union, helps scientists refine their ideas and present them more clearly to others. Also important are chance (or arranged) meetings with other scientists in the halls, next to a poster, or over coffee. Lots of fun and important ideas are exchanged at such conferences, and scientists can come away with totally new ideas about what to do next. — PL

Today I am blogging from San Francisco, California. I am attending the American Geophysical Union (AGU) meeting in San Francisco, California. It is a meeting that I try to come to every year. AGU is a professional organization made up of scientists who study the Earth and our solar system.

A conference like this one is a way for scientists to share information. The picture below shows how the scientists show each other the research they have performed. You might be thinking, “Dr. C, that looks a lot like a science fair that my school has.” You would be right. Poster presentations are very similar to science fair projects that students do.

figure_1_agu.jpg

Figure 1. Poster session at the AGU meeting.

Coming to the AGU meeting gives me a chance to see my scientist friends. My friend Claudia Alexander is the lead scientist on the Casini-Huygen project and Rosetta mission for NASA. The Casini-Huygen project is a satellite that is studying Saturn and its moon Titan. The Rosetta mission is going to study what makes up comets.

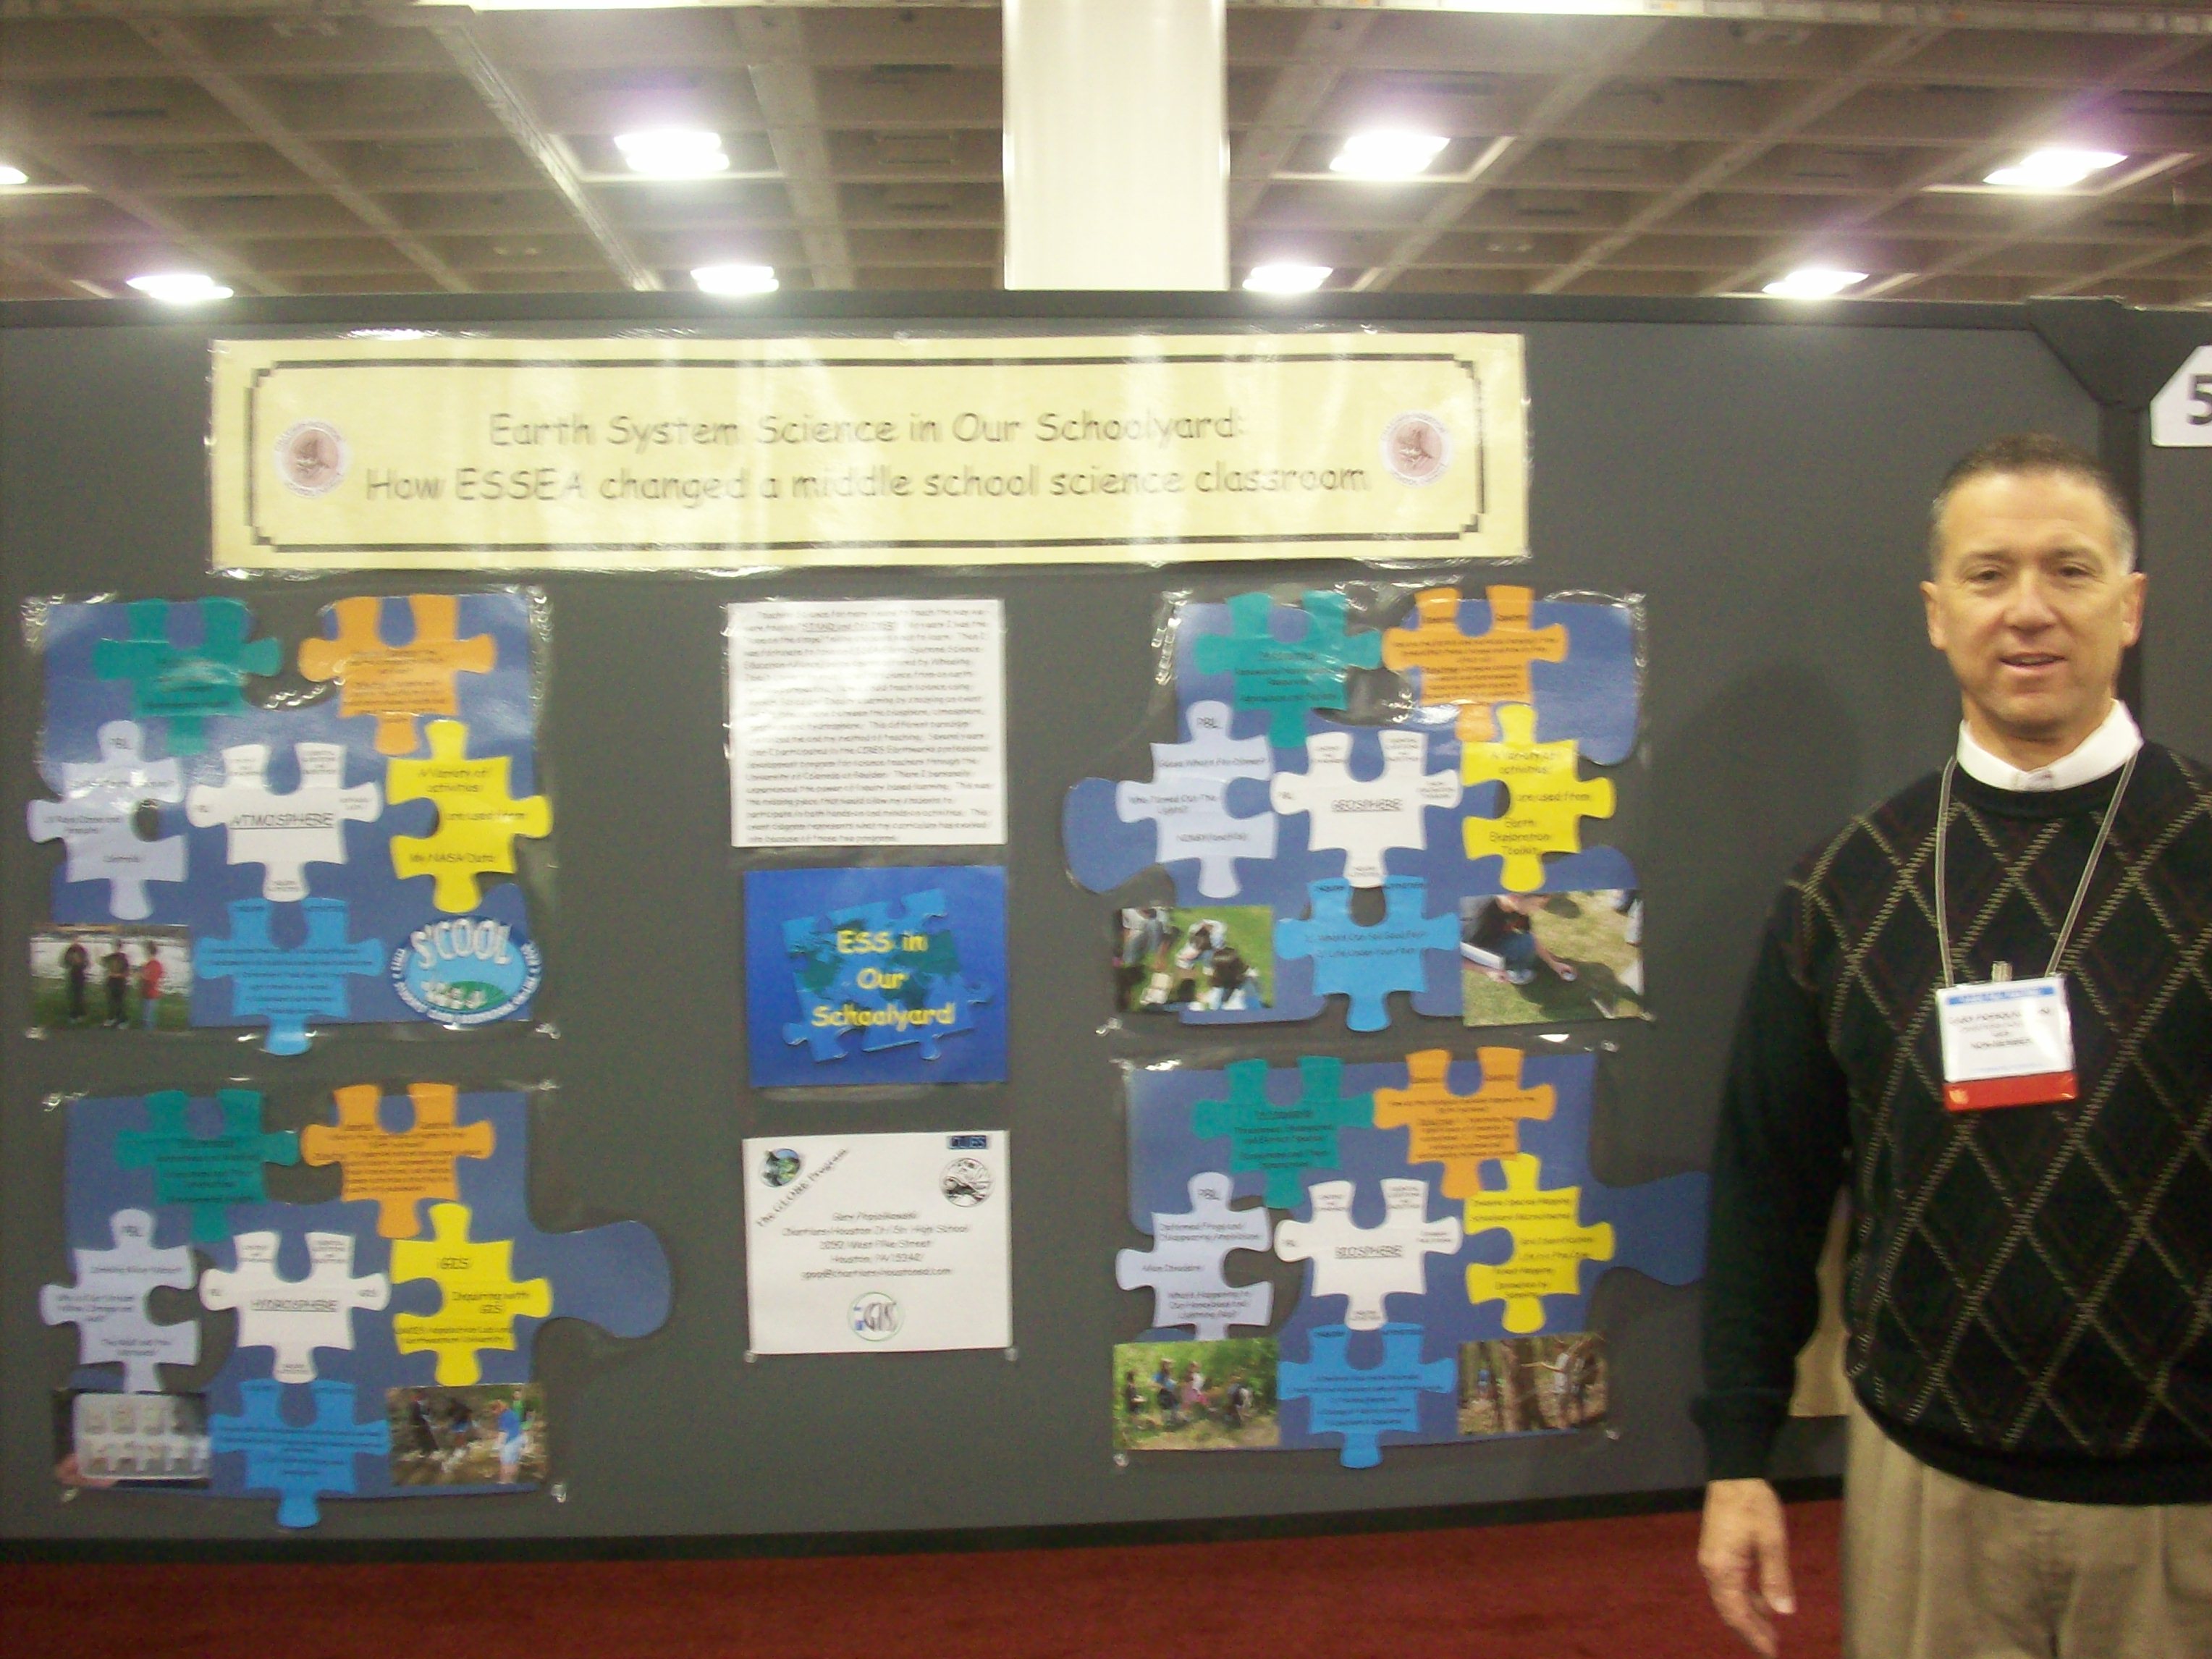
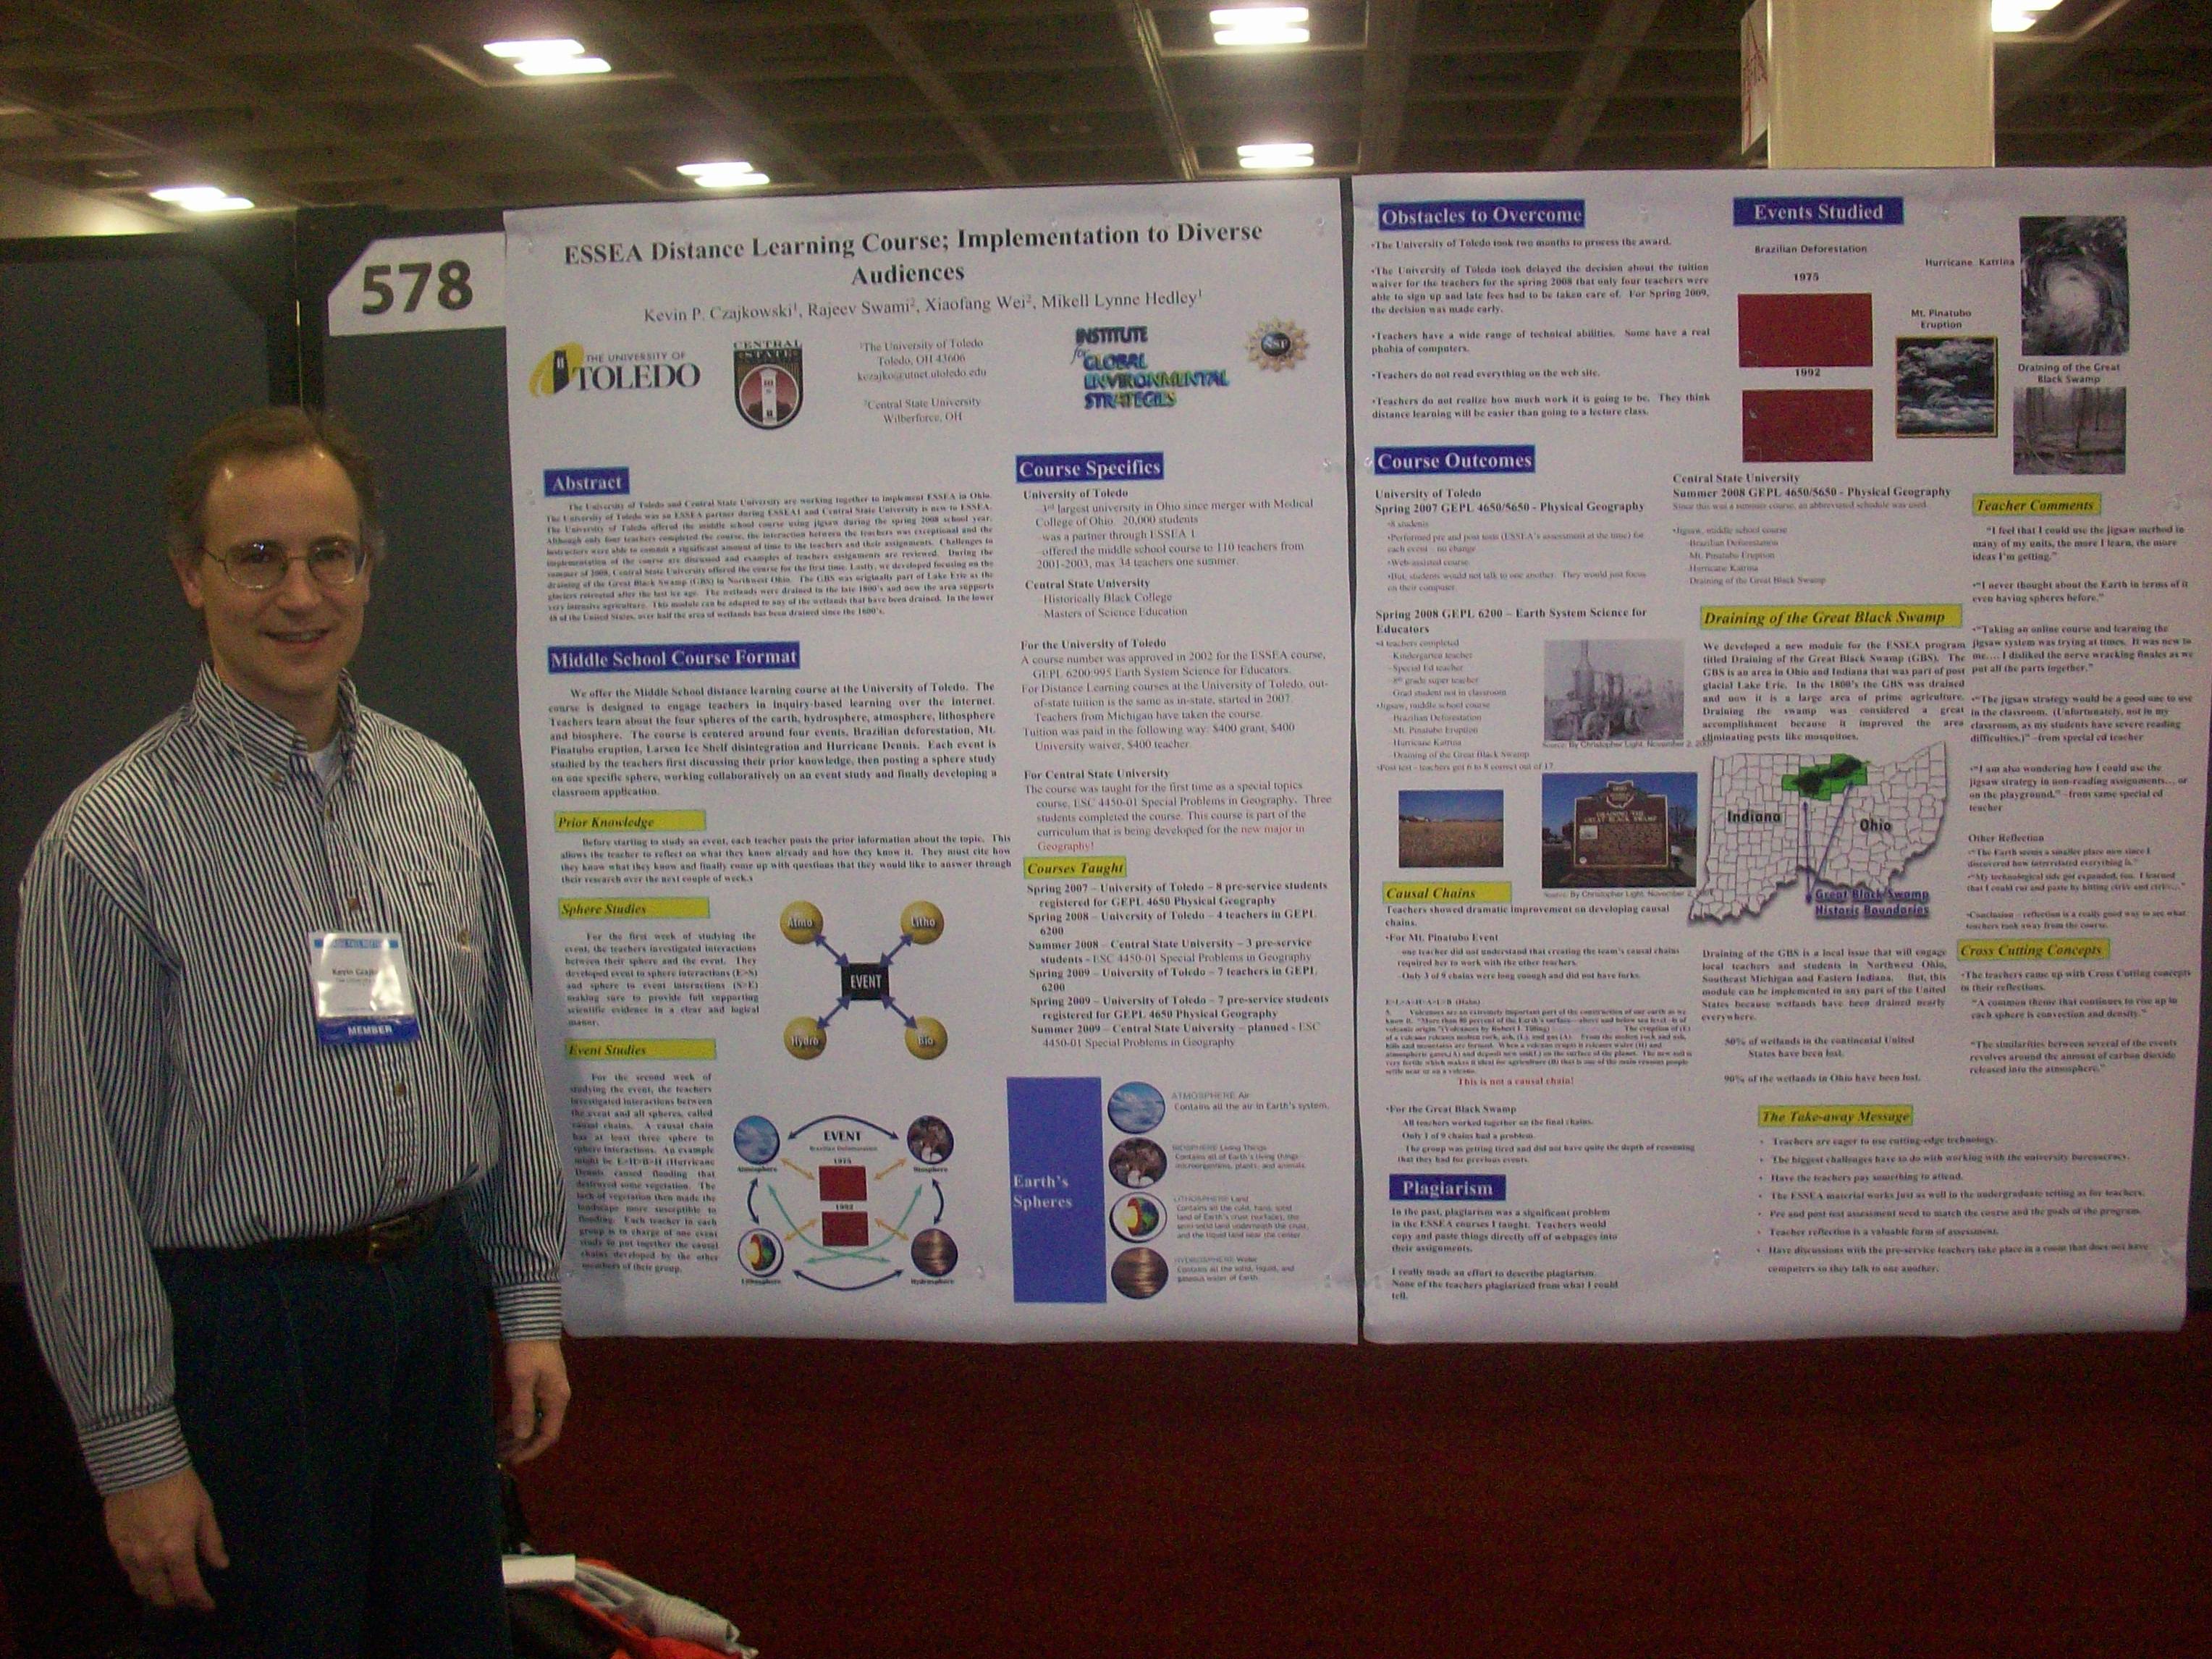
I presented a poster on an Earth System Science education course that I teach. Teachers take the course to continue their learning. You may have not known that either. Below is a picture of Gary Popiolkowski. He is a seventh and eighth grade science teacher at Chartiers-Houston Jr./Sr. High School in Houston, Pennsylvania. His students made the poster for him. It is a great poster as you can see from the picture. He mentioned to me how proud he was of his students for designing and making the poster.

figure_2_100_0678.jpg

Figure 2. Teacher Gary Popiolkowski

figure_3100_0679.jpg

Figure 3. It’s me, Dr. C in front of my poster at AGU.

Dr. C

Posted in Atmosphere, Earth as a System, Field Campaigns, GLOBE Protocols | Leave a comment

Czajkowski’s GLOBE Surface Temperature blog 12-15-08

This is the start of the last week of the surface temperature field campaign.

Wow, the weather around the Northern Hemisphere sure has been active. It looks like in the United States we are going to have a good old-fashioned winter with cold temperatures and stormy conditions.

Can you tell that I like winter?

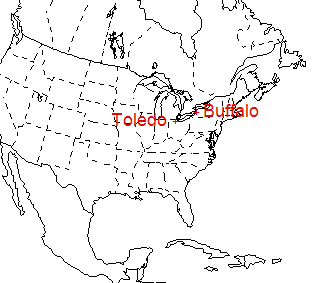
I started to take an interest in weather when I was 10 years old growing up in a suburb of Buffalo, NY. Buffalo is at the eastern end of Lake Erie. The area receives significant snowfall each year called lake-effect snow. This is caused by cold air from Canada passing over the warm water in fall and winter. The air collects water vapor from Lake Erie as it crosses the lake and deposits in on the downwind side. In 1977, there was an incredible blizzard in Buffalo called the Blizzard of ‘77. School was cancelled for 5 days straight. I thought it was the best thing going. Funny, though, that my love of missing school has turned into a love for winter weather and led to my career as a professor.

Here is a recap of what has happened over the last week. There has been flooding in Hawaii as well as in Italy.

figure-1_buffalo_loc.gif

Figure 1. Location of Buffalo (New York) and Toledo (Ohio) on map of the United States.

New England Ice Storm
New England received a terrible ice storm. The storm slowly moved up the east coast of the United States and produced up to an inch of ice on tree limbs and power lines. Many trees were damaged and power lines were brought down, knocking out electricity to over a million people.
Rare snow in Texas and Louisiana
The same system that caused the ice storm produced measurable snow as far south as Houston, Texas and Lake Charles, Louisiana. See the snow cover map below to see where the snowfall occurred. Kids had a lot of fun making snowmen and throwing snow balls.

figure_2.jpg

Figure 2. Snow depth map for 12 December 2008.

Blizzard in Montana, North Dakota, South Dakota and Minnesota
The weather pattern has changed dramatically. When the ice storm occurred, there was cold air and storminess in the eastern United States. The western United States was warm and calm. That has now changed. A significant winter storm has moved into the western United States. This has given much needed snow and rain to Washington, Oregon and California. This system has been accompanied by extreme cold temperatures in the Canadian plains and northern United States. High temperatures were in the –15º C range. That’s cold by anybody’s standard. The strong high pressure system in Canada that brought the cold air along with the storm system (low pressure system) produced very strong winds in Montana, North Dakota and South Dakota. This produced dangerous conditions, white-out snow conditions, drifting snow and dangerous wind chills. I have experienced four real blizzards in my lifetime. To be a blizzard, the wind speed has to be greater than 35 mph (16 m/s), visibility has to be below a ¼ mile (0.4 km), and temperatures have to be cold for three hours straight. The blizzard of ’77 in Buffalo was by far the worst blizzard I was ever in. Blizzard conditions lasted for three days straight.

Cold temperatures in Toledo, Ohio produced early ice
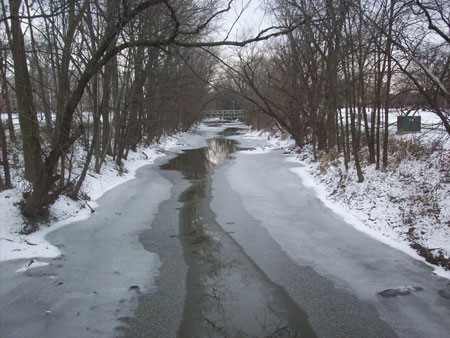
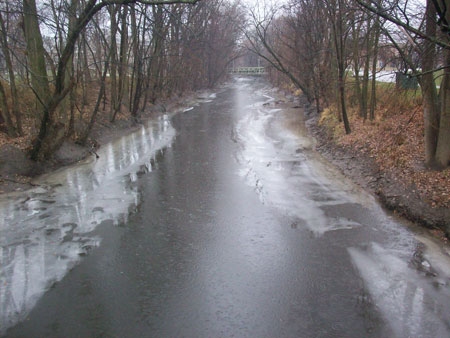
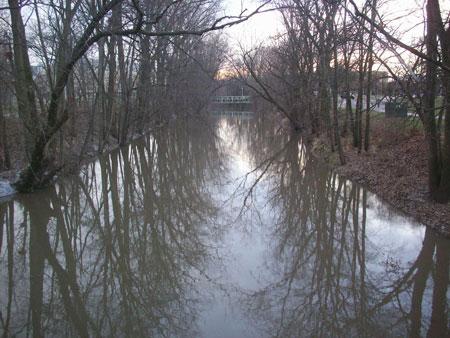
Where I live near Toledo, Ohio, most of November and thus far in December have been colder than the long-term average. In fact, so far in December, temperatures have averaged 4º C (7º F) below the long-term average. Ice has formed on ponds, lakes and rivers. My students and I are studying the Ottawa River that flows through the University of Toledo campus. We are doing this as part of GLOBE’s Seasons and Biomes Project. We are studying the way in which the river freezes and thaws. The observations were taken from a foot bridge and an attempt was made to keep the same part of the river in the frame. You can see in the images below that the river was ice free on 3 December 2008. By 8 December 2008, ice extended out from the banks of the Ottawa River about 4/10 of the way out on both sides of the river. There was a small area of open water down the middle of the river. Lastly, the ice started to melt on 9 December 2008 and then was completely gone by 10 December 2008 when there was quite a bit of rain. This week-long freeze up and thaw down pattern is common in Toledo, Ohio due to the changeable weather.

figure_3.jpg

Figure 3. Ice on the Ottawa River, Toledo, Ohio, 3 December 2008

figure_41.jpg

Figure 4. Ottawa River, 8 December 2008.

figure_51.jpg

Figure 5. Ottawa River, 9 December 2008.

figure_61.jpg

Figure 6. Ottawa River, 10 December 2008.

Here are schools that have entered data so far in the field campaign:
There have been 592 observations from 40 schools now recorded for the surface temperature field campaign. John Marshall High School in Glendale, WV has the most by far with 80 observations. Thanks Mrs. Clark, GO Monarchs! Peebles High School in Peebles, Ohio has logged 56 observations, thanks Mrs. Sheppard, and Dalton High School in Dalton, Ohio has reported 54, Thanks Mr. Witmer. And, thank you to all of the students from these schools.

Roswell Kent Middle School, Akron, OH, US [26 rows]
Dalton High School, Dalton, OH, US [54 rows]
Chartiers-Houston Jr./Sr. High School, Houston, PA, US [2 rows]
Lakewood Middle School, Hebron, OH, US [3 rows]
The Morton Arboretum Youth Education Dept., Lisle, IL, US [3 rows]
Peebles High School, Peebles, OH, US [56 rows]
Gimnazjum No 7 Jana III Sobieskiego, Rzeszow, PL [13 rows]
Penta Career Center, Perrysburg, OH, US [6 rows]
Canaan Middle School, Plain City, OH, US [20 rows]
Mill Creek Middle School, Comstock Park, MI, US [10 rows]
Brazil High, Brazil Village, TT [15 rows]
Kilingi-Nomme Gymnasium, Parnumaa, EE [16 rows]
Swift Creek Middle School, Tallahassee, FL, US [12 rows]
National Presbyterian School, Washington, DC, US [3 rows]
The Bryan Center, Bryan, OH, US [3 rows]
Maumee High School, Maumee, OH, US [12 rows]
Whittier Elementary School, Toledo, OH, US [4 rows]
Huntington High School, Huntington, WV, US [8 rows]
St. Joseph School, Sylvania, OH, US
Warrensville Heights High School, Warrensville Heights, OH, US [2 rows]
WayPoint Academy, Muskegon, MI, US
Gimnazium No 1, Sochaczew, PL [17 rows]
St. Michael Parish School, Wheeling, WV, US [4 rows]
Anthony Wayne High School, Whitehouse, OH, US [4 rows]
Bellefontaine High School, Bellefontaine, OH, US [20 rows]
Oak Glen High School, New Cumberland, WV, US [12 rows]
Nordonia Middle School, Northfield, OH, US [11 rows]
Orrville High School, Orrville, OH, US [6 rows]
Bowling Green Christian Academy, Bowling Green, OH, US [23 rows]
Polly Fox Academy, Toledo, OH, US [10 rows]
McTigue Middle School, Toledo, OH, US [3 rows]
Highlands Elementary School, Naperville, IL, US [8 rows]
South Suburban Montessori School, Brecksville, OH, US [20 rows]
NASA IV&V Educator Resource Center, Fairmont, WV, US
John Marshall High School, Glendale, WV, US [80 rows]
Birchwood School, Cleveland, OH, US [21 rows]
Orange Elementary School, Waterloo, IA, US
Hudsonville High School, Hudsonville, MI, US [19 rows]
The University of Toledo, Toledo, OH, US [25 rows]
Main Street School, Norwalk, OH, US [37 rows]

Dr. C

Posted in Atmosphere, Field Campaigns, General Science, GLOBE Protocols | 1 Comment

Czajkowski’s Field Campaign — 9 Dec 2008

This is the third installment from Dr. Czajkowski Last night, we had snow here in Colorado. In my front yard in Boulder, we had about 23 centimeters of snow. Three kilometers to the east, at Foothills Lab (close to the GLOBE offices), the “official” reading ws 17 centimeters — a six-centimeter difference of 3 kilometers. This difference is real — snowfall amounts are often greater closer to the mountains.

Hi All,

Things are continuing to go well with the surface temperature field campaign. As of December 8, 2008, there were 317 surface temperature observations from 31 schools were added to the GLOBE website.

Major Winter Storm in the United States

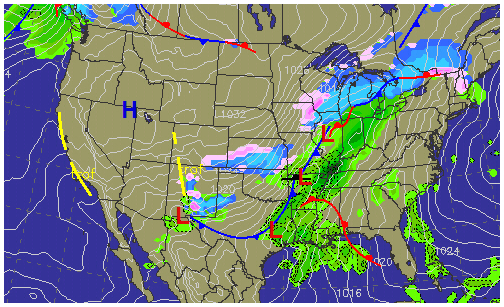
There is a major winter storm in the center of the United States this Tuesday, 9 December, 2008. This map is for 1:00 p.m. Eastern Standard Time which is 1800 UTC. This low pressure system with its associated warm front and cold front is producing a lot of rain, “wintry mix” (rain and snow, pink shades in figure 1), and some snow in the Midwest. You can also see that there is a cold high pressure system in Nevada and Idaho.

figure_1_crop.jpg

Figure1: Surface weather map 9 December 2008, The radar shows snow in the blue shades and the heaviest rain is shown in black. Figure from http://www.rap.ucar.edu/

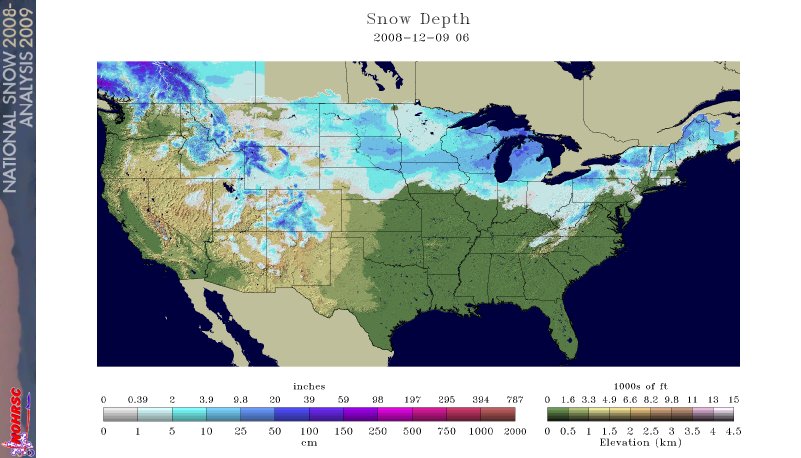
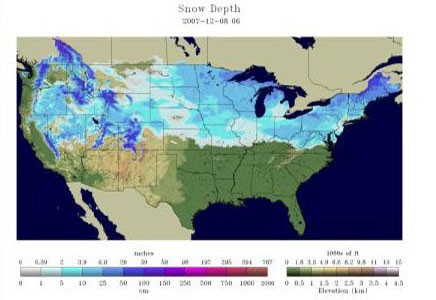
There have been some pretty extensive snowfall in the United States this fall and early winter. But, you can see from the figures below that there was actually more extensive snowfall cover in 2007. By the weekend the weather pattern in the United States is going to change to have a storm in the western United States and warm weather in the eastern United States. This storm should give significant snow out west and to the Rocky Mountains. This will make the weather in the Great Lakes warmer.

figure_2_2008snowfall.jpg

Figure 2: Snow cover and depth from NOAA for 9 December, 2008 .

figure_3_.jpg

Figure 3: Snow Cover in the United States for 8 December 2007 from NOAA.

Here are schools that have entered data so far in the field campaign:

More and more schools are participating and getting their data on the GLOBE website. Keep up the good work.

Roswell Kent Middle School, Akron, OH, US [9 rows]
Dalton High School, Dalton, OH, US [8 rows]
Chartiers-Houston Jr./Sr. High School, Houston, PA, US [2 rows]
Lakewood Middle School, Hebron, OH, US
The Morton Arboretum Youth Education Dept., Lisle, IL, US
Peebles High School, Peebles, OH, US [25 rows]
Gimnazjum No 7 Jana III Sobieskiego, Rzeszow, PL [6 rows]
Penta Career Center, Perrysburg, OH, US [3 rows]
Canaan Middle School, Plain City, OH, US [2 rows]
Mill Creek Middle School, Comstock Park, MI, US [8 rows]
Brazil High, Brazil Village, TT [9 rows]
Kilingi-Nomme Gymnasium, Parnumaa, EE [10 rows]
Swift Creek Middle School, Tallahassee, FL, US [3 rows]
National Presbyterian School, Washington, DC, US
Maumee High School, Maumee, OH, US [5 rows]
Whittier Elementary School, Toledo, OH, US [2 rows]
Huntington High School, Huntington, WV, US [8 rows]
Warrensville Heights High School, Warrensville Heights, OH, US
Bellefontaine High School, Bellefontaine, OH, US [6 rows]
Oak Glen High School, New Cumberland, WV, US [12 rows]
Nordonia Middle School, Northfield, OH, US [4 rows]
Orrville High School, Orrville, OH, US
Bowling Green Christian Academy, Bowling Green, OH, US [6 rows]
McTigue Middle School, Toledo, OH, US [3 rows]
Highlands Elementary School, Naperville, IL, US [2 rows]
South Suburban Montessori School, Brecksville, OH, US [3 rows]
John Marshall High School, Glendale, WV, US [30 rows]
Birchwood School, Cleveland, OH, US [9 rows]
Hudsonville High School, Hudsonville, MI, US [7 rows]
The University of Toledo, Toledo, OH, US [4 rows]
Main Street School, Norwalk, OH, US [16 rows]

Stay Dry.
Dr. C

Posted in Atmosphere, Earth System Science, Field Campaigns, GLOBE Protocols, Seasons and Biomes | 3 Comments

Czajkowski’s Field Campaign — 4 December 2008

This is the second of a series of blogs for Dr. Kevin Czajkowski’s surface-temperature field campaign. It is exciting to see how many schools are participating! Here in Colorado, we ate our lunches outdoors earlier this week, while the eastern U.S. was quite cold. In contrast to Ohio, where Dr. C. lives, Boulder, Colorado’s snow was quite late this year. The “official” first snow as measured for our “snow pool” was on 4 December! Other parts of Colorado (and Boulder’s official Weather Service site) got snow before 4 December, but still much later than average.

Hi All,

As of December 4, 2008, there were 207 surface temperature observations from 27 schools added to the GLOBE website. Go Team! This is great.

Here are schools that have entered data so far in the field campaign:

Roswell Kent Middle School, Akron, OH, US [12 rows]
Dalton High School, Dalton, OH, US [12 rows]
The Morton Arboretum Youth Education Dept., Lisle, IL, US
Peebles High School, Peebles, OH, US [32 rows]
Gimnazjum No 7 Jana III Sobieskiego, Rzeszow, PL [6 rows]
Penta Career Center, Perrysburg, OH, US
Canaan Middle School, Plain City, OH, US [2 rows]
Brazil High, Brazil Village, Trinidad and Tobago [6 rows]
Kilingi-Nomme Gymnasium, Parnumaa, EE [12 rows]
Swift Creek Middle School, Tallahassee, FL, US [2 rows]
National Presbyterian School, Washington, DC, US
Maumee High School, Maumee, OH, US [4 rows]
Whittier Elementary School, Toledo, OH, US [2 rows]
Huntington High School, Huntington, WV, US [8 rows]
Warrensville Heights High School, Warrensville Heights, OH, US [2 rows]
Bellefontaine High School, Bellefontaine, OH, US [8 rows]
Oak Glen High School, New Cumberland, WV, US [12 rows]
Nordonia Middle School, Northfield, OH, US [5 rows]
Orrville High School, Orrville, OH, US
Bowling Green Christian Academy, Bowling Green, OH, US [3 rows]
Highlands Elementary School, Naperville, IL, US [4 rows]
South Suburban Montessori School, Brecksville, OH, US [4 rows]
John Marshall High School, Glendale, WV, US [28 rows]
Birchwood School, Cleveland, OH, US [10 rows]
Hudsonville High School, Hudsonville, MI, US [9 rows]
The University of Toledo, Toledo, OH, US [4 rows]
Main Street School, Norwalk, OH, US [16 rows]

If you have entered data today and do not see your school’s name, do not worry. The database is updated each night. I expect that there will be many more schools involved this year.

I love the comments that the students put with your observations. Here is one from Roswell Kent Middle School, “shoes sunk into mud approx. 40 mm deep.”

Oak Glenn High School, “Buses had recently (past 10 minutes) driven around the perimeter of this surface.”

Peebles High School, “SLIGHLY WINDY AND VERY COLD!!!!!!!!!!!”

Sorry about the cold. That seems to be a theme of everyone’s observations. Field work is sometimes dirty and you have to endure difficult situations. Take a look at this picture of me doing field work in Oklahoma in 1999. I was nervous about the bull.

kevinbull.gif


Figure 1. Dr. C. doing field work on an Oklahoma Pasture.

The cold weather sure has arrived in the Great Lakes. Temperatures are averaging 5-8º C below average for this time of year. I set up an ice rink in the back yard of my house this morning for my kids to skate on. The last two years I was not able to get ice to form until mid January. The cold weather is going to stick around in the eastern United States for a least another week as well as in Estonia. Trinidad and Tobago is in the tropics and stays warm all year long so I would expect it to stay that way.

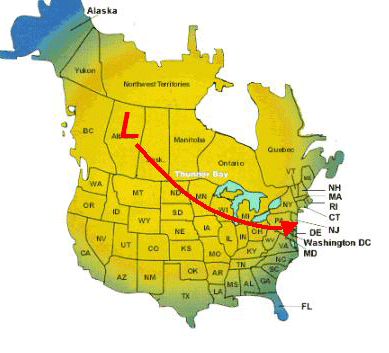
The forecast in the United States is for a series of “Alberta Clippers” to sweep down out of Canada towards the Great Lakes and eventually off the east coast (see the figure below). Each storm will bring 10-30 mm of snow to most areas near the Great Lakes. These storms are very dry because they have not tapped into any ocean moisture. Once the storms pass, they bring very cold air out of Canada behind them. This is how I know that it will be cold for the next week.

clipper.gif

Figure 2. Map showing storm (low pressure area, denoted by the L) coming out of the Canadian Province of Alberta (the letters are partially covered by the “L.” These low pressure areas are called Alberta Clippers because they often come out of Alberta.

Dr. C.

Posted in Field Campaigns | Leave a comment