Surface Temperature Field Campaign – Day 17

13 December 2007

I’ll have to say that I haven’t posted a message on the blog lately partly because I was busy with finals at the University of Toledo and my trip to San Francisco for the American Geophysical Union meeting. But, I also have had bloggers block. I didn’t know what to write about. Well, now I have a lot of things that I want to write about. Some of it will have to wait until next week.

All of the snow has melted in Toledo, Ohio. The temperatures over the last couple of days have gotten above freezing. You are all probably aware of the ice storm that hit the center of the country. That system caused a little bit of snow yesterday in Toledo but the forecast of 5-10 cm (2-4 inches) of snow did not pan out. But, the system caused a good amount of snow in southern New York state, Pennsylvania and even 25 cm (10 inches) in Boston, Massachusetts. Among the schools that have entered data for the surface temperature field campaign, White Cloud School in White Cloud, Michigan has reported 27 cm (11 inches) of snow on the ground.

It looks like another major winter storm is going to move out of the mountains over the weekend, across the country, to the east coast of the U.S. (see Figure 1 below). The map shows the low pressure system will be over Tennessee Saturday evening and will be spreading snow from Oklahoma to Pennsylvania. It looks like the drought stricken parts of United States will be getting some much needed rain. This storm should be a good one with strong winds. The forecast for Toledo, Ohio is 10-15 cm (4-6 inches) of snow. Locations in the southern part of Ohio should get more snow as should the eastern United States. I bet all of the students will be wishing the storm had hit during the week….

It looks like the snow will stick around as well. After the storm goes by, much colder conditions are expected. The temperature should remain below freezing for several days at the minimum. I hope I can get out my cross country skis. Also, I’ll try to go sledding with my kids.

Surface Temp Campaign image

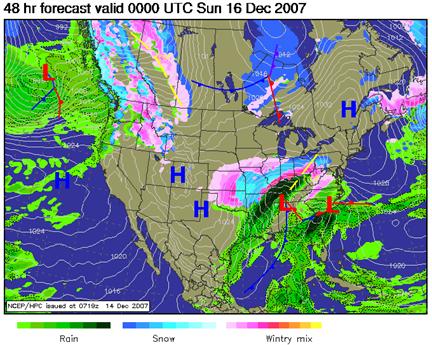
Figure 1. Forecast map for 0Z Sunday, 16 Dec. 2007 (which is Saturday night in North America).

Surface Temperature Satellite Data

Timothy Ault, a Research Scientist at the University of Toledo, helped me by plotting up the students’ surface temperature observations. He took the student observations from the GLOBE Web site and plotted them in a Geographic Information System (GIS) to map the values overlaid on MODIS data from the Aqua satellite image. In the image below, you will see how much of Michigan, central Pennsylvania, and western New York are covered with clouds. [I apologize to the schools from Alaska, Iowa, Illinois, Estonia and Poland that are not on this map. I wanted to show what could be done with the data so I picked an area that covered the most schools possible.] The MODIS image was acquired from the rapid response Web site.

As you can see from the student measurements, the surface temperatures in Michigan under the cloud cover are much cooler than the surface temperatures in northeast Ohio and southwest Pennsylvania. The areas without cloud cover tend to have much warmer temperatures. When I was at AGU, Dr. Dorothy Hall from NASA Goddard Space Flight Center mentioned that scientists do not know the surface temperature under clouds because the clouds block the signal that the satellite can observe. This is a good example of how student observations are adding to our scientific knowledge. The students can measure something that the satellites can’t.

The students’ observations of cloud cover are denoted by the numbers to the left or above the circle. These are the nominal cloud cover percentages associated with the categories of the GLOBE observations. Clear – 5%, Isolated – 17.5%, Scattered – 37.5%, Broken – 70% and Overcast – 95%. You might be able to see that the student cloud cover observations do not seem to match the MODIS cloud observations especially in northern Ohio and southwest Pennsylvania. Why do you think that is? If you notice, Tim did not put the time the satellite went over and the time of the student observations on the map. Would the time of observation of clouds be important? And could that be the reason that there are differences?

In the MODIS image, you can see the urban heat island effect. I have an arrow pointing out Columbus, Ohio which shows up clearly as warmer than the rural areas surrounding it. Dayton, Ohio and Pittsburgh, Pennsylvania also show up warmer as well.

Surface Temp Campaign image

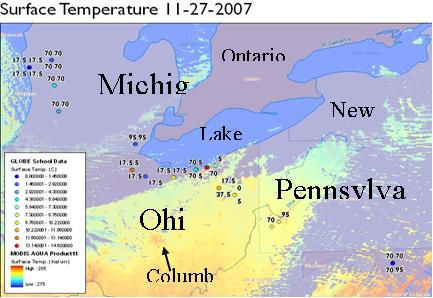
Figure 2. Student observations of surface temperature mapped onto a surface temperature MODIS image for 27 November 2007. The surface temperature measured by the students is in the circles and color coded according to the legend on the left. The number above or to the left of the circle is the nominal cloud cover percentage.

As of this morning, we are up to 556 observations from 32 schools. I was able to add the observations from the University of Toledo last night. It is nice to see so many observations coming in. Not that this is a competition, but the students from some schools are putting a lot of effort into the field campaign. I’m very impressed. I put the number of observations next to the schools with more than 20 observations.

Roswell Kent Middle School, Akron, Ohio, USA – 37 observations
Rockhill Elementary School, Alliance, Ohio, USA – 28 observations
Dalton High School, Dalton, Ohio, USA – 64 observations
Chartiers-Houston Jr./Sr. High School, Houston, Pennsylvania, USA
Cloverleaf High School, Lodi, Ohio, USA – 37 observations
The Morton Arboretum Youth Education Dept., Lisle, Illinois, USA
Mill Creek Middle School, Comstock Park, Michigan, USA
Kilingi-Nomme Gymnasium, Parnumaa, Estonia – 22 observations
Polaris Career Center, Middleburg Heights, Ohio, USA
National Presbyterian School, Washington, DC, USA
White Cloud Public, White Cloud, Michigan, USA – 33 observations
Blue Valley High School, Stilwell, Kansas, USA
Perkins Middle School, Akron, Ohio, USA
Steeple Run School, Naperville, Illinois, USA
Kittrell Elementary School, Waterloo, Iowa, USA
Lorain Community College Early College High School, Elyria, Ohio, USA – 46 observations
Ingomar Middle School, Pittsburgh, Pennsylvania, USA
Moosewood Farm Home School, Fairbanks, Alaska, USA – 21 observations
Roxboro Middle School, Cleveland Heights, Ohio, USA
Bowling Green State University, Bowling Green, Ohio, USA – 28 observations
Ida Elementary School, Ida, Michigan, USA
Whitehall High School, Whitehall, Michigan, USA – 22 observations
Taaksi Basic School, EE2914, Viljandimaa, Estonia
Birchwood School, Cleveland, Ohio, USA – 34 observations
Gimnazium in Toszek, Toszek, Poland – 20 observations
Waynesboro Senior High School, Waynesboro, Pennsylvania, USA
Eastwood Middle School, Pemberville, Ohio, USA
Orange Elementary School, Waterloo, Iowa, USA
Estes Park High School, Estes Park, Colorado, USA
Hudsonville High School, Hudsonville, Michigan, USA
University of Toledo, Toledo, Ohio, USA
Main Street School, Norwalk, Ohio, USA – 20 observations

Take care,

Dr. C

Posted in Atmosphere, Climate, Field Campaigns, GLOBE Protocols | Leave a comment

SCUBAnauts Operation Deep Climb – Postscript

As you saw in the last blog, two of the SCUBAnauts — Collin and Anna — descended in submersibles to about 400 m beneath the ocean surface to explore the seas of Hawaii. What kind of environment did they likely encounter?

If you go to the FLEXEforum Web page, you will find a plot that shows how the temperature varies with depth at a tropical site (9° N latitude) which should not differ too much from the Hawaiian region (20° N, 157° W).

The temperature inside the submersibles reached 15-16° C when they were 400 m below the surface. How cold was it in the water outside? If the graph applies (it should be close), the temperature outside was a bit cooler – more like 12-13° Celsius. If they could go down farther, they would have reached even cooler temperatures.

Why does the ocean get cooler farther down?

In the ocean, the wind stirs up the water. This results in a “mixed layer,” which is about 100 m deep in the figure. If we magnified the upper part of the figure, you would find that the temperature very near the surface can change with depth. When the wind is calm, the sun will heat up just the upper part of the ocean, and it can get quite warm. Flying over the ocean on a calm day, you can find pools of warm water — 30° C and higher in the tropics. Sometimes this water is recently fallen rain, which is less salty and hence less dense than ocean water, and thus won’t mix down as well as salty water when the wind blows. The instrument used — an infrared thermometer — is much like the one used in the GLOBE surface temperature protocols.

But this is only part of the story. From the Web site above, click your mouse to see ocean temperature profiles in other parts of the world. In the high latitudes, the surface water temperatures are much cooler, about 3° Celsius in the figure. This cold water, being dense (water is densest at 4° Celsius), can sink and spread out near the bottom of the ocean, beneath the warmer waters at lower latitudes.

Thinking about the SCUBAnauts, explore the FLEXE Web site further. There is even a link on the right hand side to try your hand at piloting a submersible (Alvin). And you can now follow the FLEXE Research Cruise and read a Teacher’s Blog from the FLEXE cruise where she and scientists are studying temperature variation in the extreme deep-sea environment, and looking to see how the vent ecosystem has changed since a major seafloor eruption two years ago! You can access all of these links from the GLOBE FLEXE page. Check back often for updates and during the week of December 17th and a link to a Phone Call from the Extreme between the research cruise and the GLOBE Program office.

Surface Temp Campaign image

Temperature as a function of depth, measured at 9 Degrees North. For further information about this plot and what is means, visit the FLEXEforum Web page.

Posted in FLEXE, SCUBAnauts | Leave a comment

SCUBAnauts Operation Deep Climb – Day 12

What an exciting dive!

The students made several interesting observations.

First, it was very dark by the time the submersibles made it to the sea floor, at about 400 meters. Life that depends on photosynthesis cannot exist below about 200 m underwater. (Remember when the students climbed, less air was exposing them to more ultraviolet light! Heights and depths make a big difference!)

Second, the submarine in the picture looks “like new.” “Why?” I wondered. I had read that sunken ships were often the home to coral reefs. A look on the Web indicates that most corals need sunlight to live, because the algae in the corals need sunlight for photosynthesis. The submarine, at 400 meters below the surface, is in the darkness, so corals can’t grow.

Third, there is still life there in the dark oceans. Some of the life we see at the surface. Sperm whales can dive 500 to 1000 meters below the surface to get food. Some animals in the dark depths feed off raining organic matter from above. Or they feed on animals that swam down from higher up.

And some life finds the energy needed to survive at the deepest ocean depths. FLEXE scientists are studying life in much deeper waters. This life depends on nutrients and a chemical source of energy that seep out of cracks in the ocean bottom, rather than the energy found in sunlight. You can learn more about FLEXE and monitor a FLEXE Research Cruise and a Teacher’s Blog of the cruise through these links.

Fourth, the divers have to go to 400 m in a submersible because of the enormous pressures at these depths. Remember that about 10 meters of water is equivalent to one atmosphere of pressure? At 400 m, weight of the water is around 40 atmospheres, so the total pressure is 41 x atmospheric pressure, counting the weight of the air as well as the water.

Day 12 – 22 October 2007

Location: Waters off Honolulu, Hawaii
Event: Deep Sea Exploration in Pisces IV and V Submersibles

Collin (Pisces V)

Anna and I arrived at the Hawaii Undersea Research Lab (HURL) vessel, Ka’imikai-O-Kanaloa (KOK), at seven o’clock Monday morning. We were brought to the vessel by my Uncle Ed Scheiffer since we stayed at his house last night. It was a beautiful morning with blue skies and calm waters typical of each day we have been in Hawaii so far. As Anna and I boarded the KOK, Terry Kerby and crew were busy preparing the ship and submersibles for departure so we were rushed to board and stow our gear.

I was extremely excited for this mission because I was finally doing it. After all the preparation and training, I was finally going to descend in a manned submersible to a great depth. It was something I never imagined I would be doing, especially at my age. Maybe it was because I was nervous, but it seemed that immediately after we boarded, the KOK left the dock and made for our destination.

Surface Temp Campaign image

Breakfast on the ship was great. They had a little of everything. But I was a bit nervous and wasn’t able to eat much. I was still thinking that there wouldn’t be a bathroom in the submersible so I didn’t want to eat or drink much. Although somewhat rushed, it was a great start to the day. On the way out, we had a fire drill which I was told was standard practice.

It wasn’t long before we reached our ship’s destination and began to prepare for the launching of the submersibles. I was to be the first in the water. When we received the OK, I began to make my way to the Pisces V (Anna was in Pisces IV), which was the submersible I would dive in. Then I made my way up the ladder and boarded through the hatch on top of the submersible. Once inside, the computer consoles and everything was lit up and it looked and felt as if I was in a space shuttle preparing for lift off and moving into a place where not many have ever gone before. I was overwhelmingly excited while we were lifted by a massive winch from the mother ship (KOK) and placed in the ocean. By the time I felt we were detached from the boat and we were on our own, I could feel the adrenaline pumping through my body.

While we were on the surface, Terry Kerby, the submersible pilot, conducted a systems check and we then started on our way to the depths of the ocean. As we descended deeper and deeper, the color of the ocean around us became darker and darker as we strayed from the sunlight. When we reached bottom, at about 1300 feet (about 400 m), it looked like something you would see on the sci-fi (science-fiction) channel. I observed orange fish that walk on the bottom, and corals that some of us have never even seen before. I can’t even describe how splendid it felt to be sitting in a submersible 1300 feet below the surface looking out into a world hidden in darkness. Everything looked amazing and peaceful on the bottom.

I was overwhelmed with awe all the way through the seven hour dive in the cramped sphere. It was difficult to move about, so the best position was to simply lie down. When we started our descent we already knew we were in the vicinity of the Japanese Midget sub that was sunk in WWII. We found the exact location by using sonar. Using the sonar, I was able to pick up shapes and objects great distances away from the sub. After about a half an hour of searching, we came across the midget sub and honed in. Suddenly, the stern side of the midget sub was staring straight at us. We had found it! I was overwhelmed at the sight. Looking at such a historical submarine that people rarely ever get a chance to see in all their life was fantastic. The sub appeared to be in great shape, exactly as it was when it was seen last.

Surface Temp Campaign image

After we were finished viewing the midget sub, we decided to move south and explore ocean that Terry Kerby has not yet seen. As we were moving south, our depth was increasing and the feeling in the sub was tense. We had no idea what to expect. Once, unexpectedly, a deep sea shark actually came up from under the sub and swam by the porthole. Other forms of life that we saw were different corals living on rock piles and fish we had not seen before. We also used the robotic arm to pick up two mugs and a Coca-Cola bottle from years ago. We made a final depth of about 1800 feet, and then we got the go ahead to rise from the depths. So, with that call we released the weights, and started to ascend. Once we were on the surface I felt that I accomplished something very special and that I enjoyed every part of the dive, but after seven hours in a tight space it felt good to climb out of the sub and walk.

Now that I am once again back on the ship and the submersible is secured, I have had an opportunity to reflect on this great and wonderful lifetime experience and what I have learned from it. One thing is for sure, that I have a deeper appreciation and respect for these scientists and submersible pilots and the work that they do. I also have a greater appreciation for the risks that famous explorers had undertaken before me. And I believe that I felt very much like they did at one time when we maneuvered Pisces V to discover ocean bottom that has not yet been seen by human eyes. It is an exhilarating experience and accomplishment.

Anna (Pisces IV)

I am glad that Collin went first, because I was able to watch Pisces V enter the water. First the three of them entered the sub which was then closed and the chase boat was deployed. Second, the giant wench placed the sub in the water and a man jumped from the chase boat to the top of the sub to disconnect it from the “mother ship.” Then Pisces V started to “dive, dive, dive.”

Surface Temp Campaign image

Then the Pisces IV was moved forward in preparation for the entry. Someone that worked on the boat came over and told me that I was the youngest person to go into the submersibles (Collin is older than me). Usually the youngest are grad students. Then I was told to climb the ladder and at the top I had to unfurl the Explorer’s Club Flag, I was so afraid of dropping it in the cool breeze.

Then I went down onto the submersible and Max and Bryan were also in, then our entry began. The sub was closed at 10:26am; we didn’t enter the water till 10:33am. 10:38 we began to sink and we reached the bottom at 10:55am. The sea floor was pretty and mostly sand and few rocks. Right away I was amazed to see this snake, eel type thing that was probably between 1 and 2 feet long. I also saw a few other types of eels, starfish, hermit crabs, shrimp, puffer fish, an octopus, and some small fish.

With the help of the mother ship and Terry Kerby we finally found the Japanese midget sub at 11:40am, the depth was 406.04 meters. At 3:00pm we were cleared to ascend and surfaced at 3:28pm. By 3:36pm the mother ship began to pull us in and I was standing on deck at 3:40pm.

Surface Temp Campaign image

Well my Hawaiian trip is ending, but I have made some of the greatest achievements of my life on this trip. I know I will never forget this. I am so thankful that I was chosen to represent not only SCUBAnauts, but my generation of youth explorers. This trip has, without a doubt, changed my life. I have a new confidence of the others that climbed the mountain with me and a new confidence in myself. This may affect my career because before this I had never considered exploration, research, marine sciences or even the military field.

On my last day with Mark Fowler he said, “You need to work through the valleys to make it to the peaks.” I think that this quote perfect to represent this trip. We worked through the valleys in preparing physically and mentally, also through some of the problems like the boat’s leaks. The “peaks” of this trip are pretty obvious.

Posted in FLEXE, SCUBAnauts | 1 Comment

Surface Temperature Field Campaign – Day 15

11 December 2007

Today I am in San Francisco, California at the Annual American Geophysical Union (AGU) conference. I heard today that there are over 15,000 scientists here. I bet you did not know that scientists are always learning. As you can see in Figure 1, the areas that I flew over were snow covered for the most part, that is if there were no clouds which was very common.

Surface Temp Campaign image

Figure 1. My flight path over the United States from Detroit, Michigan to San Francisco, California.

I took a bunch of pictures as I was flying from Detroit, Michigan to San Francisco, California.

Surface Temp Campaign image

Figure 2. Picture I took from my airplane of a snow covered mountainous area.

The view was great. Isn’t it amazing the quality of pictures that can be taken from an airplane with a regular digital camera? I really enjoy having a window seat when I fly.

A conference like this one is a way for scientists to share information. There are two ways that we present our work to other scientists. One is through an oral presentation, i.e. giving a talk. This is similar to what your teacher might do presenting information to you in class. The other way is through poster presentations. See figure 3 below. In this picture, there are hundreds of posters being presented at the same time. Poster presentations are very similar to science fair projects that students do.

Surface Temp Campaign image

Figure 3. Poster session at the AGU meeting December 11, 2007.

Attending the AGU meeting is also a chance for me to see my scientist friends again.

I learned some interesting things about remote sensing of snow today. Scientists at NASA Marshall Space Flight Center are using a satellite sensor called AMSR-E (Advanced Microwave Scanning Radiometer EOS). It is a sensor that uses microwave wavelengths to estimate the amount of water, called snow water equivalent, in the snow at specific locations. Interestingly, one scientist said that the ability to accurately retrieve snow water equivalent from AMSR-E is dependent on the surface temperature. This may be a type of project that could use student observations from the surface temperature field campaign.

Thirty schools and counting have participated thus far in the surface temperature field campaign. Thank you for all of your hard work.

Roswell Kent Middle School, Akron, Ohio, USA
Rockhill Elementary School, Alliance, Ohio, USA
Dalton High School, Dalton, Ohio, USA
Chartiers-Houston Jr./Sr. High School, Houston, Pennsylvania, USA
Cloverleaf High School, Lodi, Ohio, USA
The Morton Arboretum Youth Education Dept., Lisle, Illinois, USA
Mill Creek Middle School, Comstock Park, Michigan, USA
Kilingi-Nomme Gymnasium, Parnumaa, Estonia
National Presbyterian School, Washington, DC, USA
Polaris Career Center, Middleburg Heights, Ohio, USA
White Cloud Public, White Cloud, Michigan, USA
Steeple Run School, Naperville, Illinois, USA
Blue Valley High School, Stilwell, Kansas, USA
Kittrell Elementary School, Waterloo, Iowa, USA
Lorain Community College Early College High School, Elyria, Ohio, USA
Ingomar Middle School, Pittsburgh, Pennsylvania, USA
Moosewood Farm Home School, Fairbanks, Alaska, USA
Roxboro Middle School, Cleveland Heights, Ohio, USA
Bowling Green State University, Bowling Green, Ohio, USA
Ida Elementary School, Ida, Michigan, USA
Whitehall High School, Whitehall, Michigan, USA
Taaksi Basic School, EE2914, Viljandimaa, Estonia
Birchwood School, Cleveland, Ohio, USA
Gimnazium in Toszek, Toszek, Poland
Waynesboro Senior High School, Waynesboro, Pennsylvania, USA
Eastwood Middle School, Pemberville, Ohio, USA
Orange Elementary School, Waterloo, Iowa, USA
Estes Park High School, Estes Park, Colorado, USA
Hudsonville High School, Hudsonville, Michigan, USA
Main Street School, Norwalk, Ohio, USA

Take care,

Dr. C

Posted in Atmosphere, Field Campaigns, GLOBE Protocols | Leave a comment

Surface Temperature Field Campaign – Day 10

6 December 2007

So far there have been 291 observations recorded from 27 schools in the surface temperature field campaign. I have had undergraduate students participating, but we haven’t entered our observations yet. So, there will be at least one more school’s data showing up on the GLOBE Web site.

You can see below a list of the schools that have participated and entered data thus far. I would like to highlight some schools that have been doing an exemplary job:

  • The Lorain County Community Early College High School in Elyria, Ohio has entered the most observations so far with 37. Nice job Rose O’Toole-Hamman and students!
  • In a close second are:
    • Birchwood School in Cleveland, Ohio with 32 (thanks Linda Brown and students); and
    • Dalton High School in Dalton, Ohio (thanks Jerry Wilmer and students!) with 30.

Data collection accounts for about 80% of time spent on my research project. Without data, there is no way to do the research. Often I am faced with having to revise my research projects because of lack of data. It seems like you never have the right locations or right times to do a thorough study.

Most of the schools are now reporting snow with their surface temperature observations. As you can see in the maps below, there is a lot more snow on the 8 December 2007 image than on the 5 December 2007 image. This was due to a series of Alberta Clippers.

Surface Temp Campaign image

Surface Temp Campaign image

Figure 1. Snow cover for the lower 48 United States for Wednesday, 5 Dec. 2007 (top) and Thursday, 8 Dec. 2007 (bottom). Source: National Operational Hydrologic Remote Sensing Center.

Note the increase in snow cover in Michigan, Ohio, West Virginia, Virginia, Maryland and New Jersey. This was due to the Alberta Clipper that tracked from Alberta down into the United States and out into the Atlantic Ocean not too far from Washington, DC.

There are some really good examples of places where there is snow on the grass but not on the parking lot. For instance, Whitehall High School in Whitehall, Michigan reported a surface temperature of 0° C on a grassy area with 14 cm of snow. Interestingly, they reported 0° C for a bare parking lot. I am very interested to find out if this is a common occurrence to not see an effect due to the snow.

This year we have much more snow than during the field campaign last year. In fact, it was so warm last year during the surface temperature field campaign that the broccoli in my garden was still growing. I pick my last broccoli on January 1, 2007 last winter. This winter the broccoli was dead several weeks ago because of the cold. So you may be asking, “Why was it so warm in the Great Lakes region last December and so cold this December?” My understanding is that last December there was an El Nino in the Pacific Ocean that lead to warm conditions in the Great Lakes region. This December there is a La Nina in the Pacific Ocean that is leading to the cold conditions in the Great Lakes. I won’t go into the details of this. That can be the subject of another blog entry.

The number of schools participating has stayed nearly the same over the last couple of days. There are many more schools involved, but they have not been entering their observations yet on the GLOBE Web site.

Roswell Kent Middle School, Akron, Ohio, USA
Rockhill Elementary School, Alliance, Ohio, USA
Dalton High School, Dalton, Ohio, USA
Chartiers-Houston Jr./Sr. High School, Houston, Pennsylvania, USA
The Morton Arboretum Youth Education Dept., Lisle, Illinois, USA
Mill Creek Middle School, Comstock Park, Michigan, USA
Kilingi-Nomme Gymnasium, Parnumaa, Estonia
National Presbyterian School, Washington, DC, USA
Polaris Career Center, Middleburg Heights, Ohio, USA
White Cloud Public, White Cloud, Michigan, USA
Steeple Run School, Naperville, Illinois, USA
Blue Valley High School, Stilwell, Kansas, USA
Kittrell Elementary School, Waterloo, Iowa, USA
Ingomar Middle School, Pittsburgh, Pennsylvania, USA
Lorain Community College Early College High School, Elyria, Ohio, USA
Roxboro Middle School, Cleveland Heights, Ohio, USA
Bowling Green State University, Bowling Green, Ohio, USA
Ida Elementary School, Ida, Michigan, USA
Whitehall High School, Whitehall, Michigan, USA
Birchwood School, Cleveland, Ohio, USA
Moosewood Farm Home School, Fairbanks, Alaska, USA
Gimnazium in Toszek, Toszek, Poland
Waynesboro Senior High School, Waynesboro, Pennsylvania, USA
Estes Park High School, Estes Park, Colorado, USA
Eastwood Middle School, Pemberville, Ohio, USA
Orange Elementary School, Waterloo, Iowa, USA
Main Street School, Norwalk, Ohio, USA

I think I’ll get my cross country skis out.

Dr. C

Posted in Atmosphere, Climate, Field Campaigns, GLOBE Protocols | Leave a comment