The common thread between science and art: creativity

When you examine a seashell, a crystal, the skin of a snake or the wings of a butterfly, what do you think about?  Art?  Science? Or the obvious connection between the two?  At the fall meeting of the American Geophysical Union in San Francisco, CA last week, thousands of scientists, including myself, found ourselves examining the intersection of science and art through a wide variety of presentations and discussions.

My week began on Sunday evening in a special film preview of Chasing Ice, a documentary about photographer James Balog’s quest to photographically capture the rapid retreat of several Arctic glaciers.  Mr. Balog is a scientist by training and a world-renowned photographer acclaimed for his ability to capture the human element of nature on film (or SD card in this day and age).  The film is helping communicate how climate change is real and its effects are happening now, in our lifetime, as opposed to in the past or future. The music and imagery in the film definitely revitalizes your emotional connection to our planet and beckons you to action.

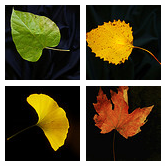
On Monday, I attended the AGU Presidential Forum presentation by Ira Flatow, host of Science Friday, a popular radio program on National Public Radio (NPR) aimed at discussing current topics in science.  One part of his presentation featured a recent science and art project sponsored by Science Friday, in which they collected photos of leaves taken by fans of the program and compiled them into a colorful collage of autumn at its finest.  Later that evening, AGU hosted an Open Mic Night.  This event was full of brave AGU attendees singing, rapping, storytelling, and sharing poetry that each individual had written themselves.  Those performances clearly illustrated how the intersection of science and art can yield spectacular displays of genuine creativity.

Mini-collage of leaf photographs compiled by Science Friday (obtained from their Flickr site)

Mini-collage of leaf photographs compiled by Science Friday (obtained from their Flickr site)

In The GLOBE Program, we also value and encourage students to stimulate their creativity by connecting art and science.  One recent example is our GLOBE Calendar Art Competition, where students from all over the world created artistic expressions of their climate.  These beautiful works of art are now featured in a 2013 calendar for us to enjoy all year long.  I participated in this competition as a judge, and I was particularly impressed by the wide range of imaginative entries that we received.  From hand-drawn cartoons to oil paintings of beautiful local landscapes, I saw evidence that creative juices are flowing vigorously in the minds of our young GLOBE scientists.
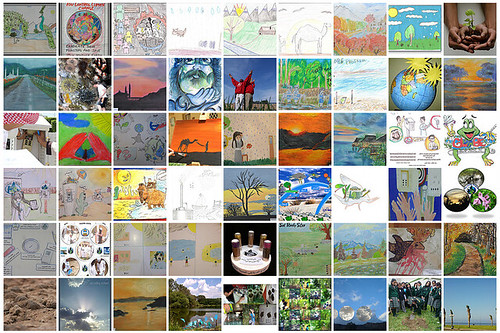
Collage of art submissions depicting climate-related topics for the GLOBE 2012 Calendar Art Competition

Collage of art submissions depicting climate-related topics for the GLOBE 2013 Calendar Art Competition

As a person who once considered college majors from music to meteorology myself (with meteorology winning out), I have always felt that the best scientists are also great artists.  And I also believe that all people are inherent scientists.  This may be best illustrated by my young toddler who conducts scientific experiments in our home everyday.  My son’s favorite experiments are often with gravity; he loves to drop things, watch as they fall, and then ask for me to fetch them.  (He also likes to test the repeatability of these experiments.)  In GLOBE, we encourage students to conduct inquiry-based learning projects; tapping this inherent curiosity to bring out their inner scientist.
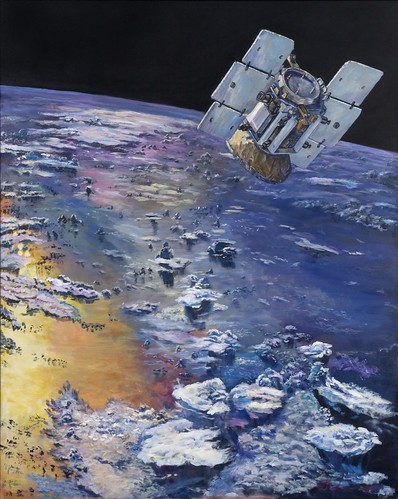
 

Artwork by GLOBE scientist and artist, Dr. Graeme Stephens, Principal Investigator of the NASA CloudSat mission.  GLOBE cloud observations are used by the CloudSat team to provide ground truth data for the satellite.

Artwork by GLOBE scientist and artist, Dr. Graeme Stephens, Principal Investigator of the NASA CloudSat mission. GLOBE cloud observations are used by the CloudSat team to provide ground truth data for the satellite.

It is my belief that the artistic mindset is what helps propel science toward new discoveries and innovations.  Scientists use creativity to approach problems in a new way; and without this key ability our scientific fields would stagnate.  Thus, science and art, which are often considered to be on two opposite ends of the spectrum (or sides of the brain), are actually the perfect and requisite complement to each other thanks to that common thread of creativity.

Suggested activity: Tap into your creativity and illustrate your observations of the Earth with art, music, stories, or poetry and share them with us on our GLOBE Facebook Page or have your teacher submit it through the “Tell Us About It” link on their My Page on the GLOBE website.  Also, stay tuned for future science and art competitions sponsored by GLOBE, such as the next Earth Day Video Competition (see last year’s competition here)

-Sarah Tessendorf

Posted in Conferences/Meetings, General Science | 2 Comments

The 2012 GLOBE Surface Temperature Campaign

The month of December features the Surface Temperature Field Campaign.  To recognize this exciting event, we are featuring Dr. Kevin Czajkowski, the scientist behind the campaign.  This post is a repost from his blog.

The GLOBE surface temperature field campaign started this week with some record warm temperatures in the United States. Students in much of the United States enjoyed short sleeve weather for several days.

Schools have started to post observations on the GLOBE website. The GLOBE website has been changed dramatically over the last year. The GLOBE Program Office will be adding all teachers in a bulk transfer from the old database in the near future. Many teachers have also signed up on the GLOBE webpage and the help desk has set them up so they can enter data. The help desk has been doing a great job managing everyone.

Here are the schools that have posted observations so far.

Burlington County Institute Of Technology, New Jersey

West Union High School, Ohio

Birchwood School, Ohio – Hi Mrs. Brown.

Lakewood Catholic Academy, Ohio – Great that you got on Mrs. McGuire

Roswell-Kent Middle School, Ohio – Hi Mr. Frantz.

Brazil School, Brazil

Main Street School, Norwalk, Ohio – Hi Mrs. Burns.

The Morton Arboretum Youth Education Department, Illinois

This is a map from the GLOBE website that shows the schools that entered surface temperature data so far on Dec. 3, 2012. Please try to have your students get your data online as soon as possible so we can trouble shoot any problems.

Screen shot of Schools that have entered surface temperature data as of 6 December 2012

As many of you know, I love snow. I love to ski and ice skate and sled. So far this winter has been a dud. There hasn’t been a lot of snow. Last winter was so warm, there was very little snow as well. As you can see in the attached figure, there is very little snow today in the lower 48 of the United States. That is the part of the United States that does not include Hawaii and Alaska. A storm recently laid down snow in Europe. The weather pattern is going to change in North America and bring the cold air from Alaska and northern Canada into the lower 48.

Snow and ice charts showing North America, Europe and Asia

Snow and ice charts showing North America, Europe and Asia

Seasons and Biomes Frost Tube

I have taken frost tube observations for the Seasons and Biomes GLOBE project for the past 3 years. I tried to take an observation this morning only to find that the tube had broken and all of the water drained out. I wonder if the plastic had gotten brittle and when it froze it broken when the ice expanded. I’ll have to fix it this weekend before consistently cold temperatures arrive next week.

Dr. Czajkowski's son holding the frost tube before it was placed in the ground

Dr. Czajkowski's son holding the frost tube before it was placed in the ground

I hope to see your data soon.

Posted in Air Temperature, General Science | Leave a comment

ENSO Basics: What’s up with the weather?

In the first post in this series, we looked at what ENSO is. Remember that the atmosphere and oceans are always moving, and in general, those movements follow a specified pattern. When the movement deviates from normal, to either an El Niño or La Niña, weather conditions in different regions of the world will respond.

But who feels these effects first? Usually, equatorial countries that border the Pacific Ocean. But even these countries can experience vastly different weather conditions. During an El Niño event, Ecuador, for example, may experience severe rain and flooding, while the northern region of Australia may have a drought. As the event continues, the regions affected grow, and countries such as India, Chile and Madagascar will feel the effects.

By studying many El Niño and La Niña events over time, scientists are able to predict that when an El Niño event occurs, during the months of December through February and then in the following June through August, the following areas will see the conditions indicated in the following image:


Feeling the effects of a warm episode

Feeling the effects of a warm episode. Image courtesy of NOAA.

Likewise, the relationships for La Niña have been documented  in a similar manner, with different effects felt in various regions:


Feeling the effects of a cold episode.  Image courtesy of NOAA.

Feeling the effects of a cold episode. Image courtesy of NOAA.

During the historical El Niño event of 1997, GLOBE students monitored the event by collecting air, water and soil temperature, solid and liquid precipitation and soil moisture data through their corresponding protocols.  These students used historical data as well as their observations to test the hypothesis laid out by scientists in the images above.  It was important to students not highlighted in the regions above to also collect data – they too were testing the hypothesis.

Even though it’s been many years since the 1997 event, this oscillation continues to occur and you are able to investigate the connection between this Pacific Ocean oscillation and your local weather.

Suggested activity: Study the maps above, and create a hypothesis that you can test.  Using historical data, test that hypothesis for a year where either an El Niño or La Niña occurred.  You can find these historical events from NOAA.  Then, be prepared to begin collecting data when another event occurs.

-Jessica Mackaro

Posted in Climate, Climate Change, Earth System Science | Leave a comment

GLOBE and adaptation to climate change

This week we have a guest blogger, Dr. Dixon Butler. Dr. Butler was the GLOBE Chief Scientist from 1996-2003 and now works as a consultant to NASA.

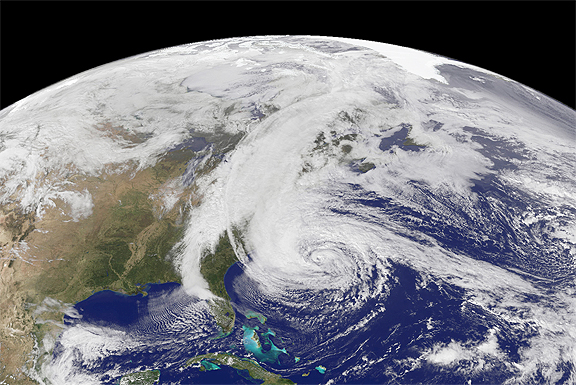
One of the most significant technology improvements in modern life is our ability to accurately forecast future events. Weather forecasts now routinely extend for five days. The recent flooding on the East Coast of the United States was forecast days in advance. The cause was an unusual merger of two storms to create a super storm – Super Storm Sandy. Atmospheric models correctly predicted that a winter storm coming from the north and a weakening tropical storm Sandy would merge with disastrous results.

GOES-13 Image of Super Storm Sandy on 28 October 2012. Image courtesy of NASA

GOES-13 Image of Super Storm Sandy on 28 October 2012. Image courtesy of NASA

In 1976, models of the stratosphere predicted significant depletion of the ozone layer and consequent increases in harmful ultraviolet sunlight reaching Earth’s surface. Manmade chlorofluoromethanes –  chemicals with one carbon atom plus chlorine and fluorine atoms – were identified as the cause, and their use as spray can propellants was banned. This led to reductions in the use of these compounds. When the Antarctic ozone hole was discovered years later and all use of them was banned, there were less of these chemicals in the atmosphere. The ozone layer is now recovering, but this process will continue for more than a century.

A look at the ozone hole located over Antarctica.  Image courtesy of NASA

A look at the ozone hole located over Antarctica. Image courtesy of NASA

We now recognize that our activities can have worldwide lasting effects. We also have more and more skill in predicting the effects of our activities. This skill depends on better measurements, taking measurements at finer spatial scales, building more powerful computer models of the environment, and pushing these models to finer spatial resolution.

Climate is long-term by definition. Generally questions of climate involve averages of conditions (e.g., rainfall, atmospheric temperature) over 30-year periods and longer as well as the likelihood of extreme events such as tropical storms, blizzards, and droughts. We humans are always making decisions that depend on what we think future climate will be. In the past, societies generally based decisions on the expectation that the climate would not change. When this proved wrong, whole societies disappeared or radically changed their cultures and economies.

Some decisions about how and where we live and locate our different activities can now be made taking into account predictions of future climate, but many long-term decisions cannot rely on current predictions because they are not accurate enough and they don’t provide guidance at fine enough scales. For instance, almost every human settlement is adjacent to a water body – a river, lake, or ocean. In planning for the future, everyone would benefit from knowing where future floods will occur. No one wants to build a factory, shop, or home where there will be flood damage every few years during the useful life of the building.

GLOBE data can contribute to improving future forecasts and our ability to adapt to a changing climate. Measurements that provide data on finer special scales are required to enable accurate models and predictions at these scales. By adding a wealth of data covering where we live in more detail, GLOBE students are doing their part to help better decisions about where we choose to live and work in the future – to help us all adapt to climate change.

Posted in General Science | Leave a comment

ESNO Basics: What is it?

Through many posts here on the Scientists’ Blog, we, in one way or another, discuss ENSO.  ENSO, or El Niño-Southern Oscillation, is a quasi-periodic climate pattern that occurs in the tropical Pacific Ocean.  When the conditions change, the atmosphere responds in many different ways.  In certain locations, it is cloudier and it rains more, while in others it’s clear and dry.  Through our “ENSO Basics” series, we’ll take a look at ENSO in many different ways, such as how ENSO forms, what type of weather it causes, and its connection to climate.  Since we’re currently in a neutral scenario, it seems a great time to examine ENSO and not be partial to one phase or another.  Today’s post will discuss how ENSO forms.

Formation

El Niño is a temporary change in the Pacific Ocean, in the area of the Equator.  Generally, winds in this region blow strongly from east to west (in the mid-latitudes, like where the GLOBE Program Office is located, winds blow from west to east).  Since the winds blow this way over extended periods of time, water in the western Pacific “piles up”.  The water that piles up in this region is warm (approximately 30°C), since the wind pushes the sun-warmed shallow layer of the ocean.  With warmer waters, you tend to see an increase in thunderstorm activity.  So this region that has warmer water, like the northern coast of Australia, sees thunderstorm activity.

The water further east is colder (approximately 22°C) because the deeper water is pulled up to replace the water that has been pushed away. So areas along the western coast of Equatorial South America will see cold temperatures.  Figure 1, taken from the International Research Institute for Climate and Society (IRI) at Columbia University, shows a schematic of the water temperature as well as the accompanying atmospheric circulation.

Schematic of normal conditions

Figure 1. Schematic of normal conditions. From IRI.

In a positive phase, also known as El Niño, the winds that push the water to the west weaken.  Since the winds are weaker or even reverse, not as much water piles up in the western Pacific, so the water slides back toward the east.  With the warmer water sliding back toward the east, not as much cold water rises along the coast.  This results in warmer waters off the coast of equatorial South America.  Once this gets going, the situation continues and strengthens: the warmer waters cause the winds to weaken even further, which results in the ocean warming further, which causes the winds to weaken, which results in the ocean warming.  This is known as a positive feedback, and allows El Niño to grow.  Figure 2, also from IRI, shows El Niño.

Schematic of an El Nino event

Figure 2. Schematic of an El Nino event. From IRI

What happens if the winds actually strengthen? This results in even more warm waters piling up in the western Pacific and even more cold water upwelling along the western coast of Equatorial South America.  This scenario is known as La Niña, or the negative phase of ENSO, and it brings with it different weather patterns.   As with El Niño, there is a positive feedback that happens with the winds and allows the event to strengthen:  the colder waters cause the winds to strengthen even further, which results in the ocean cooling further, which causes the winds to strengthen, which results in the ocean cooling.  Figure 3, again from IRI, shows the schematic for a La Niña event.

Schematic of a La Nina event

Figure 3. Schematic of a La Nina event. From IRI

GLOBE schools have been affected by both El Niño and La Niña.  In 1997, a historically strong El Niño event took place (note: an event is classified as weak, moderate or strong depending upon how far the sea surface temperature departure from normal is over at least five consecutive months).  Students in regions affected by this El Niño took measurements to examine what the effects were locally.  As we continue in this series, we’ll be sure to feature some of the schools making these measurements.

Suggested activity: No matter which region of the world you’re located, you can examine the relationship between your local weather and ENSO.  Taking air temperature and precipitation measurements are great ways to start.  You can then connect those measurements to the Oceanic Niño Index by examining the correlation.  While many studies have been performed using the combination of these observations, it is worthwhile for students to also examine these studies, as this helps makes the connection from local to global.

-Jessica Mackaro

Posted in Climate, Climate Change, Earth System Science, General Science | 1 Comment