A tale of two extremes

Weather extremes have become a common theme in the news headlines the past few weeks. For example, nearly every part of the United States has been experiencing one of two extremes – either frigid cold or record-breaking high temperatures. Places like Arizona and California experienced below-freezing temperatures, which can have potential impacts on the crops grown in these typically balmy regions. In contrast, cities in the Southeast U.S., such as Atlanta, Georgia, had record-breaking temperatures for this time of winter. In Atlanta, the high temperature of 24.4 °C (76 °F) broke the high temperature record set in 1890 by 1 full degree Fahrenheit. Take for example the following surface weather map, showing the vast extremes in temperature across the U.S. on January 13th, 2013:
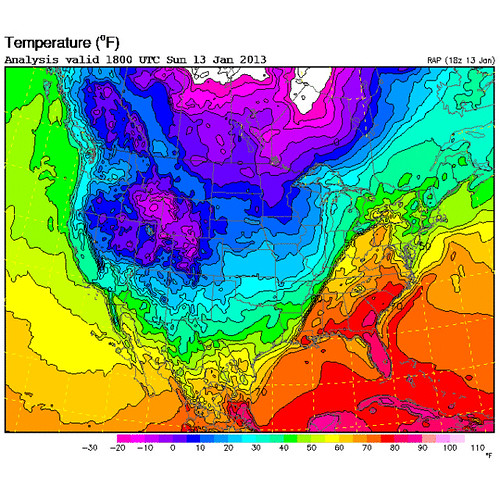
Surface temperature map of the United States, from the RUC analysis at 1800 UTC on 13 January 2013; Image courtesy of RAL Real-Time Weather Data

Surface temperature map of the United States, from the RUC analysis at 1800 UTC on 13 January 2013; Image courtesy of RAL Real-Time Weather Data

When we looked at the weather map, we were amazed to see such a strong temperature gradient, which is how quickly temperature changes over a given distance.  This was the result of a very strong cold front that moved across the country bringing chilling Arctic air into the heart of the U.S., where you can see some temperatures fell well below -17.8 °C (0 °F).  Ahead of the cold front, temperatures soared, however only until the cold front passed.  If you examine hourly observations from the Southeast U.S., you’ll find some dramatic temperature drops.  For example, in Memphis, TN, the temperature fell nearly 8°C (18°F) in only one hour and fifteen minutes.

Outside of the United States, there are many other countries experiencing extreme weather.  Thousands of people have had to evacuate their homes in Russia after a pipeline burst in the extreme and record cold and Jerusalem, Israel experienced a very rare snowfall last week.  Conversely, Australia is experiencing raging brush fires as the country is gripped by a record-breaking heat wave.  This heat wave has been so intense that road tar has melted and the Bureau of Meteorology had to add two new colors to its temperature maps.
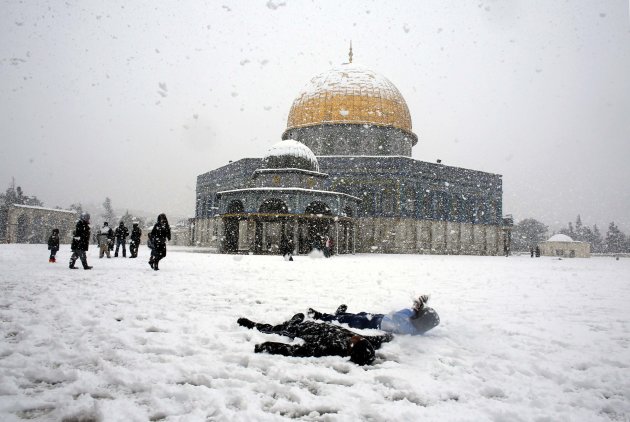
 

Children play in front of the Dome on the Rock during the recent snowstorm in Israel; Photo from Reuters/Ammar Awad

Children play in front of the Dome on the Rock during the recent snowstorm in Israel; Photo from Reuters/Ammar Awad

A map from space showing hotspots from brushfires (red dots) in Tasmania; from NASA

A map from space showing hotspots from brushfires (red dots) in Tasmania; from NASA

While these are examples of weather extremes, they are not necessarily indicators of climate.  It is important to reiterate the difference between weather and climate, as these kinds of weather extremes often get people talking about how it relates to climate and climate change.  Weather is the current state of the atmosphere, the temperatures and weather systems that sweep through a nation over the course of a day or a week, while climate is the long-term average and trend of weather events over many years.  Thus, while these weather extremes are dramatic on both ends of the spectrum, they may not affect a location’s climate unless they occur repeatedly, for many years to come.  It is also important to realize that weather extremes are not uncommon; cold fronts often create sharp temperature gradients and weather patterns can set up to create heat waves or cold spells.  However these extremes may be occurring more frequently and at record-breaking levels due to climate change.

In order to document extreme weather and if it is occurring frequently enough to impact climate, it is important to collect data on a daily basis for many years.  Over time, these data help identify if any long-term trends are occurring.  The GLOBE Program sponsors the Great Global Investigation of Climate project to encourage GLOBE schools to collect regular, daily temperature and precipitation data for this very reason.  The data collection efforts of GLOBE schools help contribute valuable data to monitor weather and climate across the planet.  Just look at this example from Fayetteville High School in Arkansas.  The daily temperature observations of maximum temperature at their school over the past two weeks illustrate the warm up and then extreme cool down that occurred as the cold front passed on January 13th.   These kinds of weather data, recorded over long periods of time, are the key pieces of evidence needed to help decipher if these tales of weather extremes are leading us toward a change in climate.

Maximum daily air temperature (degrees C) recorded by Fayetteville High School in Arkansas between 1-14 January 2013.

Maximum daily air temperature (degrees C) recorded by Fayetteville High School in Arkansas between 1-14 January 2013.

Suggested activity: Have you been affected by this recent extreme weather?  Let us know about it by leaving a comment or sending us an email.  Also, use the recent extreme weather to develop and carryout a research topic, then email it to us at science@globe.gov.  And don’t forget to collect data for the Great Global Investigation of Climate, which repeats again in March!

- Jessica Mackaro and Sarah Tessendorf


Posted in Air Temperature, Climate, Climate Change, Earth System Science, Field Campaigns | 1 Comment

GLOBE at AMS – sharing our community

93rd Annual Meeting of the American Meteorological Society

This week I attended the 93rd Annual Meeting of the American Meteorological Society (AMS) in Austin, TX.  I started attending eight years ago as a senior undergraduate meteorology major at Millersville University.  That first year, I’ll admit, was very overwhelming – great minds from various expertises within the Earth Sciences came together to share ideas and present their recent research.  The meeting brings many opportunities for sharing: from WeatherFest, a collection of over 65 interactive science exhibits that is free to the community, to posters and formal presentations at the meeting venue.

Like the past few years, GLOBE sponsored a table at WeatherFest, where we met members of the Austin community – from local scout troops to teachers and students.  We explored with them how fun and easy GLOBE is, by engaging with Green Down and Surface Temperature focused activities.  We also shared calendars from the student art competition.  Everyone who stopped by the table loved how you, our GLOBE Students, represented climate through your art.  WeatherFest occurs the Sunday prior to each AMS meeting, and next year’s will be in Atlanta, GA, USA.  Check out this link to watch a video of images from this year’s WeatherFest, courtesy of Teresa Eastburn of UCAR’s SPARK Program.

Julie and I take a moment to take a picture before the doors to WeatherFest open

Julie and I take a moment to take a picture before the doors to WeatherFest open

The Meeting officially kicked off on Monday, and I was able to present how GLOBE connects to the Next Generation Science Standards, which was timely as a new draft of the standards was released on Tuesday.  GLOBE itself connects so well to the Next Generation Science Standards , as student research projects touch on each of the three dimensions of the new standards.   The three dimensions, to be explained briefly, are Scientific and Engineering Practices, Crosscutting concepts, and Disciplinary Core Ideas.  As you’re aware, one of the key components of GLOBE is its inquiry-based, hands-on activities.  This aligns to Dimension 1 of the Standards.  To address the different cross-cutting concepts, Dimension 2 of The Standards, GLOBE Students and Teachers engage in data analysis and application to research projects.  Finally, basic GLOBE, the implementation of GLOBE protocols aligns to Dimension 3 – disciplinary core ideas.  By looking at even one project, such as the Oyster Gardening and Climate Change project from Trinity Lutheran School in Newport News, VA, USA, it is easy to make the connection.  Once the standards are finalized, we’ll be sure to feature a post or two dedicated to how GLOBE connects to them.

On Tuesday, GLOBE was presented again to the AMS audience by showing how GLOBE students are environmental stewards in their local communities.  Since the presentation was only limited to 12 minutes, I was only able to discuss two projects: one from students in the Czech Republic who were looking out for toads crossing a busy highway, and another from students in Pakistan who created fliers to pass out to the community in hopes to clean up and protect their local water source.  Everyone in attendance was impressed when they realized that students recognize problems, research these problems using GLOBE protocols and work to find a solution.  Also on Tuesday, one of our GLOBE Teachers, Mr. Peter Dorofy from the Burlington County Institute of Technology in New Jersey, received the American Meteorological Society’s K-12 Educator Award.  He attended the meeting too, and will be blogging about his experience at the science conference in the near future.

As the week came to a close, we feel confident that The GLOBE Program had been shared in many ways with this wide scientific audience.  I was able to meet scientists and educators who are able to bring amazing expertise to students and teachers alike. I have been able to reconnect with GLOBE partners, who are attending the meeting as representatives of their organization, as well as network with the local Austin community in hopes to recruit new GLOBE teachers and schools.  It is our hope that in future meetings, we can continue to present what you, our GLOBE Community, are doing.  Whether it be future results of another competition or presenting the latest way our students are environmental stewards, members of the American Meteorological Society are inspired by what you are doing.

Suggested activity: Students – Get together with your classmates and look around your community to find a local problem and develop a project to answer the question.  Then, submit it to us through the GLOBE Facebook Page or have your teacher submit it through the “Tell Us About It” link on their My Page on the GLOBE Website.Teachers – read through the latest draft of the Next Generation Science Standards and provide your feedback.   The draft will be open for comments until 29 January 2013.

-Jessica Mackaro


Posted in Conferences/Meetings, Earth System Science, General Science | Leave a comment

Cloud forests and how trees get water

Most trees obtain water through their massive root systems, but did you know that some trees can absorb water through their leaves as well? This ability is called foliar uptake. Scientists recently discovered that trees in cloud forests use foliar uptake to obtain water. A cloud forest is a forest that has persistent or seasonally persistent fog or low-level cloud cover. Cloud forests are usually in the tropics or subtropics, have evergreen trees (trees that don’t lose their leaves) and tend to have a lot of mosses and vegetation in the understory of the trees.

Cloud Forest

Cloud Forest located in Mount Kinabalu, Borneo Photo Credit: Nep Grower

Scientists became interested in how cloud forests work after they started studying some of the amphibians and migratory birds that live in cloud forests.  For a long time, a lot was known about the animals, but not about the vegetation that provided homes for all these animals.  This inspired a group of researchers from the University of California at Berkeley to research the cloud forests of Monteverde, Costa Rica. The cloud forests in Monteverde receive precipitation about 9 months out of the year.  During the other three months, Monteverde receives very little precipitation, but it does get fog.  Some parts of the forests will have fog for an average of 13 hours per day.  This fog forms when moist air from the Caribbean Sea condenses under the forest’s canopy.

Quetzal

A quetzal - a bird that lives in cloud forest trees Photo Credit: Drew Fulton (Canopy in the Clouds)

In order to study where the water in the trees comes from, scientists heated a spot on their branches and then tracked how the warmed water under the spot moved.  If the water moved towards the leaves, it came from the roots.  If the water moved towards the trunk, it came from the leaves.  After studying trees both in and out of cloud forests, the scientists found that the trees in the cloud forests could store 20% more water for growth via foliar uptake than the trees outside of the cloud forests.   Scientists had long suspected that the ecology of cloud forests was tied to the fog and low-level clouds, but not until this research was conducted were they able to say that cloud forests do obtain water via the clouds.

For more information, here is a research group in Costa Rica that studies cloud forests.

Some of our GLOBE schools are near cloud forests.  We would love if you could share your pictures and experiences via email to science@globe.gov or by leaving a comment.  Also, for all our GLOBE schools – we want to wish you a Happy New Year and remind you to always keep investigating!  You might find something amazing.

-Julie Malmberg

Posted in Earth as a System, Land Cover | 2 Comments

Hummingbird populations – How GLOBE students can help

GLOBE’s Earth as a System investigation area cultivates students’ awareness of an intricate web of global connections. Similar to real world scientists, students explore life science concepts, learning that “organisms can only survive where their needs are met.”  The Earth as a System investigation area encourages students to observe patterns and connections, such as through phenology. Phenology is the study of how living organisms respond to seasonal changes in their environment. Only through observing and measuring can we notice if changes are occurring and how they occur.

For example, GLOBE Scientist Sarah Tessendorf recently wrote about her experiences of observing seasonal changes near the GLOBE Program Office. To contribute to GLOBE’s growing database as well as model the learning that GLOBE classrooms conduct each week, the Science and Education team completed the Green-Down Protocol on a tree near our office building.   You can read about these experiences in a blog posted earlier this year.

Seasonal changes mean different things for humans than they do for flora and fauna. While humans in Boulder, Colorado, can wear different clothes or eat different foods to adapt to seasonal variations, the effects of these changes weigh heavier on other living organisms, such as hummingbirds.

One of our other phenology protocols is the Ruby-throated Hummingbird Protocol.  In this protocol, students observe the arrival and departure of hummingbirds, monitor their visits to flowers and feeders, and observe nesting behavior.  This is the exact type of research that National Science Foundation scientists recently wrote about for the journal Ecology. Scientists from the Maryland, Colorado, and Arizona are investigating how the flowering time of the glacier lily, a favorite of hummingbirds and bees, could potentially impact hummingbird populations.  The scientists have found that the glacier lily is blooming 17 days earlier than it did in the 1970s.  In earlier decades, hummingbird migration coincided with the flowering dates.  However, in recent years, hummingbirds have been arriving towards the end of, or even after, the bloom dates.

Glacier Lily

Glacier Lily Photo Credit: David Inouye

Broad-tailed hummingbirds, the type of bird in this study, fly from Central America to the mountains in the western United States to breed and raise their young.  The broad-tailed hummingbirds depend on glacier lily nectar for food.  So, what happens when the hummingbirds arrive and there are no more flowering plants?  These scientists speculate that it could be detrimental for the broad-tailed hummingbird populations.

Broad-Tailed Hummingbird

Broad-Tailed Hummingbird Photo Credit: David Inouye

This goes back to the principle that organisms can only survive when their needs are met – understanding the dynamic interrelations between seasonal changes, limited food, and survival of populations are important lessons.  GLOBE students make valuable contributions to our understanding of hummingbirds – GLOBE student-collected data is a valuable contribution to scientists and global understanding of these birds.

Has your school done the Ruby-throated Hummingbird Protocol?  Or have you investigated another type of animal that migrates into your community?  Let us know what you have found by either commenting or sending an email to science@globe.gov.

-Julie Malmberg

Posted in General Science | Leave a comment

The chicken and egg story of global warming and extreme droughts: A lesson on climate feedbacks

I recently read that the extreme drought in western North America during 2000-2004 actually resulted in more carbon dioxide being released into the atmosphere. In the article in Nature Geoscience, it explained that such droughts can further enhance global warming. When a drought occurs, the plants wither and die and no longer uptake carbon dioxide (normally living plants serve as a carbon sink in the global carbon cycle since they consume carbon dioxide). Furthermore, after plants die and start to decay they actually produce carbon dioxide, thereby serving as a carbon source. However, as our planet warms due to carbon dioxide being released at records levels into our atmosphere, climate extremes (such as droughts and floods) are expected to continue to become more frequent and severe (giving rise to the term non-stationarity).


A graphical representation of carbon dioxide variations.  From Science Blogs

A graphical representation of carbon dioxide variations. From Science Blogs

So I began to wonder, is global warming causing more droughts?  Or are more droughts leading to more global warming?  Which caused the other first (e.g., which came first—the chicken or the egg)?

While our understanding of the Earth System would imply that droughts alone have not caused global warming, it is now clear that they can further enhance it.  This is an example of a positive feedback loop in the Earth System.  A positive feedback means that one process occurs, causing a subsequent process to occur that results in an outcome that further enhances the first process, and the cycle amplifies and continues over time.  A negative feedback, however, would cause the opposite to happen where the subsequent process results in an outcome that counteracts or weakens the first process.

There are also examples of negative feedbacks in our Earth System.  Take for example when the Earth’s ocean surface temperature heats up, it causes more evaporation from the oceans.  This additional source of moisture into the atmosphere over the oceans can lead to more low-level marine clouds.  Low-level marine stratocumulus clouds are often very reflective of solar radiation, so more of these clouds can thus increase the Earth’s albedo (or solar radiation reflectivity) and thereby cool the ocean surface temperatures.

Another example of a positive feedback; the changing albedo when sea ice melts due to global warming.  From Vancouver Observer

Another example of a positive feedback; the changing albedo when sea ice melts due to global warming. From Vancouver Observer

Don’t be fooled, however, by the terms positive and negative feedback, which may imply one is good and one is bad.  It is actually often the opposite; that the negative feedbacks are what produce balance in the Earth System, whereas the positive feedback loops can act like a runaway train.  Either way, most of these processes are completely natural; however, some can and are being influenced by human activity.  As responsible residents of this planet, we need to do our best to understand how our actions are affecting our home and try to prevent any runaway trains from occurring on our watch.

Suggested activity: Investigate the albedo of various surfaces near you in the GLOBE Surface Temperature Field Campaign and try to estimate if the surface cover changed, would it act as a positive or negative feedback in your local community.

-Sarah Tessendorf

Posted in Climate, Climate Change, Earth System Science | Leave a comment