Non-stationarity: New vocabulary for a changing climate

A few years ago I attended a workshop for early career scientists to discuss frontiers in integrated water-climate-society vulnerability and adaptation science. This interdisciplinary area of science focuses on the need for using scientific information to not only identify communities that are vulnerable to climate change, but to also help create effective approaches for communities to adapt to climate change. Since every society needs water to survive, the focus was on water and climate.

Thus, the workshop brought together emerging scientists in the physical sciences (e.g., atmospheric and climate scientists, hydrologists) and the social sciences (e.g., anthropologists, sociologists). I attended the workshop representing atmospheric scientists who study the water cycle, and I learned a lot about the need for interdisciplinary efforts to address problems in the water-climate-society nexus. One of the things I learned was a new term: non-stationarity.

Non-stationarity means that what used to be normal is not normal anymore. It means that our climate system can no longer be considered stationary. The extremes in our climate system of the past, can no longer be considered the outer limits of what our current and future climate system can exceed. For example, a 100-year flood could now be expected to happen more frequently than once in a 100-year period; thus it may become a 50-year flood, or less.

Image looking at the magnitude and frequency of 100 year floods

Image looking at the magnitude and frequency of 100 year floods, from Ohio Department of Natural Resources

The principle of non-stationarity has broad implications. Insurance companies, that base their rates on the likelihood that extreme events will or will not occur, are now having an even harder time doing their risk analyses. Engineers that build dams, levees, and bridges are challenged to build structures that can withstand extreme conditions that we used to not think possible. And communities, especially those in areas vulnerable to sea level rise, drought, or floods, are faced with even tougher potential conditions to adapt to. While the term is just becoming part of my vocabulary, the effects of non-stationarity will be felt for years to come. Thus, accepting this new concept and starting to frame our adaptation solutions around it is crucial as our communities respond to the changing climate.


Future drought. These four maps illustrate the potential for future drought worldwide over the decades indicated, based on current projections of future greenhouse gas emissions.

Future drought. These four maps illustrate the potential for future drought worldwide over the decades indicated, based on current projections of future greenhouse gas emissions. From Aiguo Dai, NCAR.

Suggested GLOBE activity: Taking climate measurements regularly, for many years to come, will help provide data to establish climate baselines (or “normals”), and over a long enough period of time will help monitor if these baselines are shifting. You can contribute to these climate data sets by participating in the Great Global Investigation of Climate, the Climate and Land Cover project, and/or the Phenology and Climate project.

If you are interested in interdisciplinary science related to the water-climate-society interface, please see a resource list that was compiled by workshop participants to learn more about programs to get involved in.

-Sarah Tessendorf

Posted in Climate, Climate Change, Earth System Science | Leave a comment

Full Circle Superior Part IV: Changing Superior, Changing Industry

This week we pick back up on our Full Circle Superior Series.  In 2010 Mike Link and Kate Crowley chose to walk around the largest fresh water lake in the world – Lake Superior which has shoreline in both Canada and the United States. This 1555 mile/145 day walk was the first ever by a couple and the first to attempt to stay on the shoreline. Because Mike and Kate are educators in their sixties they wanted to deliver important information about the lake to inspire others to care for it. As a researcher and college professor Mike wanted the adventure to have information for his courses and for research institutions around the lake.  This is Part VI in the Full Circle Superior series.  For more information, read Part I, Part II, and Part III.

While there are many issues facing land owners along the shores of Lake Superior, there are other concerning issues, such as the wild rice and fish spawning area on the Bad River Reservation in Wisconsin.

To Chippewa tribes around the Lake Superior basin, wild rice (manoomin) is “the food that grows on water.” It fulfilled a prophecy in the story of the Chippewa tribe’s migration from the east – how they would know they had found their new home. The Chippewa culture bases its history and survival on the natural harvest of fish and wild rice. In 2007, The Bad River Band, a tribe of Chippewa Indians in Northwestern Wisconsin, had to forego ricing because of the low water level. When this happens in isolated years it might allow the reseeding and expansion of rice production, but when it happens over a decade, no one can predict the outcome.

Young wild rice shoots floating on the Kakagon Sloughs, a coastal wetland on Lake Superior, Bad River Reservation, Wisconsin

Young wild rice shoots floating on the Kakagon Sloughs, a coastal wetland on Lake Superior, Bad River Reservation, Wisconsin. Photo taken by K. Rodriguez. From US EPA.

In addition to the impact on wild rice, the natural fisheries of the lake have been impacted by many factors.  One such impact is the toxins that have entered bays with large factories that lacked the pollution prevention filtering. Many of those toxins remain in the water decades later. With water level reduced, the toxins concentrate in the water; the water warms and the fish species that might spawn are prone to failure because of both toxicity and temperature. We had expected to eat more fresh caught fish as we walked around, but the fishing, while good in some areas, has never fully recovered from the earlier combination of overfishing and the arrival of the sea lamprey. The wetlands that we need to be productive were so dry that we walked through many of them without getting our feet wet. This means the food sources for the fish, the habitat for birds, turtles, and other wetland species have had a prolonged period of limited production. We know wetlands are natural filters, but they cannot filter the water if the water does not reach the plants.

Another well documented impact of lower lake levels is  the impairment of shipping..  It speaks to the fact that the issue of low water and the changes in our climate are more than isolated affects, more than the concern a few individuals. Sea Grant, a NOAA administered network of 32 university-based programs that work with coastal communities, discussed this in their 2007 newsletter.

“From an economic standpoint, cargo ships have had to lighten their loads and sometimes vessels have been excluded from harbors. Additionally, power plants at the Soo Locks are running at a diminished capacity.  In August 2012 a 1027 foot freighter went aground within the St Mary River Channel that connects Lake Huron to Lake Superior with the final lift coming at the locks.  The boat not only suffered damage to its hull, it also caused numerous large vessels to anchor in Whitefish Bay and wait for the locks and river to clear for their downbound journey.

For the shipping industry, a one-inch (2.5 cm) water level drop can mean over 250 tons of coal will be left on the dock when a thousand-footer weighs anchor. A two-foot drop means that upwards of 6,000 tons, approximately ten percent of a thousand-footer’s capacity will be left behind. And it’s not like companies can just send more ships to pick up the slack.”

In these areas of concern we were not able to do original research.  Instead, we reviewed existing research, talked to scientists, and then made our observations in light of that knowledge.  On our hike we watched people swimming in Lake Superior like they do in our smaller lakes.  The water temperature was 20° F above normal in 2012.  It is worthy to note that in July of this year, temperatures on both land and water were the highest on record.

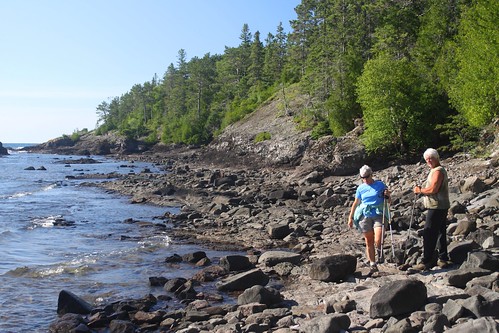
Walking along the coast of Lake Superior

Walking along the coast of Lake Superior

Through our trip, our concerns became for the indigenous people of the lake, the resident lake owners and recreationists, the fish, the quality of the water, the economy, and the natural landscape. The continued argument over global climate change  should focus instead on observing what changes are going on and take necessary action. We need to prevent damage to our fresh water and our air. We need to think about the future and not debate whether humans can create a change in the climate – of course we can, just like we can create Chernobyls, BP oil spills, Hungarian toxic sludge flows, and Bhopal plant explosions!

In August of 2012, scientists published a report that worried about the change in the lake effect on communities because it no longer had a cooling effect in 2012.  If the warming continues the lifestyle and the cooling bills along the lake will change dramatically. To put it as plainly as we can: We have seen too many things done to our planet during our lifetime and we think that putting the planet first is a good idea and starting with Lake Superior is a wonderful way to begin the process.

Posted in Backyard Science, Climate, Climate Change, Earth System Science | 2 Comments

As the last leaf falls

This was my first year doing the Green-Down Protocol with GLOBE. I am trained as an atmospheric scientist, so I have taken many atmospheric measurements over the course of my career. I had not ventured into the world of phenology until I joined GLOBE. More so, I am intrigued by this field of Earth Science, since it is closely connected to climate and can be a very good indicator of a climate change.

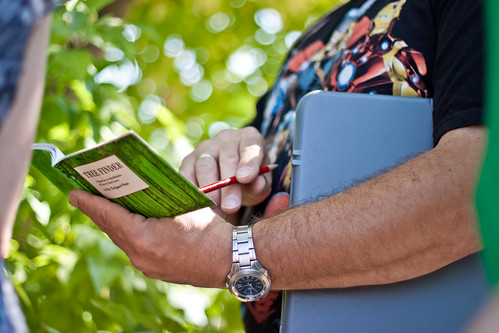
This year, as part of the GLOBE Phenology and Climate Project, myself and other scientists at The GLOBE Program Office established a phenology site near our office building. Our colleague and GLOBE Master Trainer, Gary Randolph, trained us in how to follow the Green-Down Protocol. We found a non-irrigated tree that faced toward the equator (south since we are in the Northern Hemisphere), identified the tree as a Boxelder (scientific name of Acer negundo) using our Rocky Mountain tree finder guide, and documented the site location using a GPS.

Using the Rocky Mountain Tree Finder to identify our tree

Using the Rocky Mountain Tree Finder to identify our tree

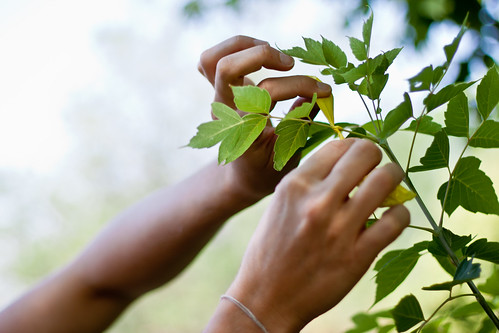
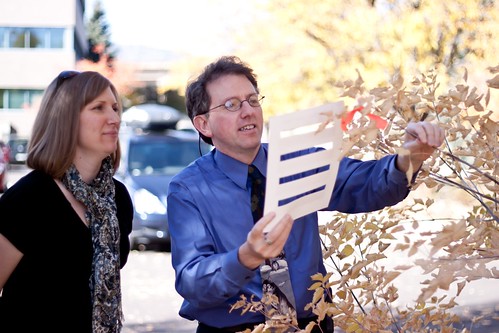
Then, we selected four leaves on an accessible branch, including a terminal leaf and marked them by tying bright orange tape around the stems. The marking tape we utilized was actually used construction caution tape that we were “recycling” for our measurements, and we had labeled each piece with a number for each leaf.

Marking the leaves with recycled tape at the phenology site

Marking the leaves with recycled tape at the phenology site

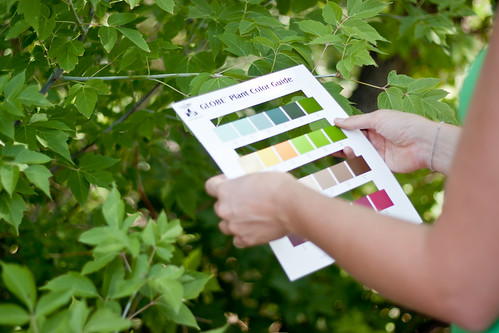
We each took turns comparing the leaves with the GLOBE Plant Color Guide. It was not always easy to tell exactly which color the leaf was, but we matched the predominant color of the leaf and came to a consensus among our group before recording the observations. Most of the time, we were all in agreement, but when we weren’t we discussed it and came to a decision as a group. We also established a soil temperature site near the base of our tree, in which we took soil temperature measurements at 5 cm and 10 cm and the air temperature every time we did green-down observations.

Determining the color of our leaves with the GLOBE Plant Color Guide

Determining the color of our leaves with the GLOBE Plant Color Guide

Over the past month and a half, we went out to collect data about twice per week. At first the leaves’ color didn’t change. While this made taking the measurements less exciting at first, it was very important that we had begun early in order to make sure we captured the onset of the green-down process. Nonetheless, in the past couple weeks we realized the leaves were turning color quickly, so we started going out three times per week to capture the color changes in our data. Early this week, we arrived at our green-down site to find three of the four leaves had fallen to the ground. The one leaf that remained intact was very fragile, curled up, and lacking in color compared to what it had once been.

GLOBE Director Dr. Tony Murphy makes one of the final green-down measurements

GLOBE Director Dr. Tony Murphy makes one of the final green-down measurements

As I looked around at the trees near our site, I was amazed at the variety of stages of green-down that the nearby trees were in. Some trees had already lost almost all of their leaves, while some still had vibrant greens and yellows on display. I wondered what causes such variation in the timing of green-down from tree-to-tree? Could it be dependent on the species of tree or the amount of sunlight it gets? Perhaps it relates more to the soil conditions and soil moisture? Or maybe it is a combination of factors together, such that maybe each species needs certain amounts of sunlight and moisture to prevent green-down from beginning? When I asked myself these questions I was exercising my curiosity about the world around me. For me, this is the essence of science: to inquire about things I don’t understand, create hypotheses while I consider the problem, and then design a process to find the answers.

As the last leaf falls and I reflect on my experience doing the Green-Down Protocol, I realize I’ve learned much more than I could have by reading about it in a book and the experience has had a much bigger impact than a typical desk assignment. The data we collected will be archived in the GLOBE database where it can be used for research. The observations of nature that I made while being outside have left a lasting impression on me, as well as energized me to keep learning more about my environment. And this was all because four special leaves beckoned us to get outside, breath some fresh air, and do science.

Suggested activity: As you take measurements with GLOBE protocols, pay attention to what is happening around your measurement sites. Do you understand all of the changes and processes that you observe? If not, design a research project to help you answer the questions that make you curious about the environment and share it with us at science@globe.gov.

-Sarah Tessendorf

Posted in Earth as a System, GLOBE Protocols | 1 Comment

Supercomputing and climate research: high resolution long-time simulations to improve our understanding

Have you ever watched a newscast and the on-air meteorologist mentions “according to our weather models, our best chances for rain will occur between the hours of 6 and 9 pm”? Have you wondered what exactly are those models they’re talking about?

A weather model is a series of equations that take a look at an initial state of the atmosphere (such as the temperature, pressure, and humidity) and look ahead to see how the conditions will change over time. As early as the 1920’s, weather forecasts have been produced using this method. It wasn’t until the 1950’s that the era of numerical weather prediction began using computers. Since then, the use and improvement of these models has been imperative to successful weather forecasts, as well as climate simulations.

Different from weather forecast models, climate models look at the interactions between the atmosphere, oceans, land surface and ice. By looking at the interactions between these spheres through the past, scientists are able to project temperature change that results from concentrations of various atmospheric gases, like carbon dioxide. Recently, the National Center for Atmospheric Research (NCAR), an organization under the parent University Corporation for Atmospheric Research (UCAR), opened the Wyoming Supercomputing System.


The building housing the NCAR-Wyoming Supercomputing Center in Cheyenne, Wyoming, officially opened on October 15, 2012. (©UCAR. Photo by Carlye Calvin.)

The building housing the NCAR-Wyoming Supercomputing Center in Cheyenne, Wyoming, officially opened on October 15, 2012. (©UCAR. Photo by Carlye Calvin.)

This center is important to not only NCAR, but the atmospheric science community as it attempts to provide the computing capabilities for improvement of tornadoes, hurricanes, earthquakes, droughts and climate simulations.  Models are limited by the computers they run on.  The launching of this new system allows scientists to do what they couldn’t before.

The computers housed at NCAR-Supercomputing Wyoming Center (NSWC) allow for high resolution modeling.   High resolution means that the difference between grid points (the physical points where the equations are solved) is smaller.  High resolutions allow for small scale weather phenomenon, such as tornadoes, to be resolved as well as run long simulations in time.  Resolving smaller scale weather phenomenon means that the features of the weather system are able to been in output.


Earth’s climate system. This image depicts a single month from a simulation of the 20th century by the NCAR-based Community Climate System Model (version 4). This image captures wind directions, ocean surface temperatures, and sea ice concentrations. The arrows show just how close together the model grid points reside (©UCAR, image courtesy Gary Strand, NCAR).

Earth’s climate system. This image depicts a single month from a simulation of the 20th century by the NCAR-based Community Climate System Model (version 4). This image captures wind directions, ocean surface temperatures, and sea ice concentrations. The arrows show just how close together the model grid points reside (©UCAR, image courtesy Gary Strand, NCAR).

Think of it this way: if you’re looking at a glass of water sitting on a table, you’ll have a really hard time seeing that small piece of dirt floating on top if you’re looking at it while you’re standing up.  If you look at it very closely, you’ll be able to see it better.  This is what these new high resolution climate models hope to do: simulate more realistically the climate system, including its variability and response to different forcings.

-Jessica Mackaro

Posted in General Science | 1 Comment

Xpedition Review: Reflections back and looking ahead

To say that the journey to the summit of Mt. Kilimanjaro was a success would not do justice to the wonderful personal and scientific experiences the team had.  From taking the first steps toward the summit on Sunday 23 September to summiting the following week and boarding flights to return home, each team member gained something that will stay with them forever.

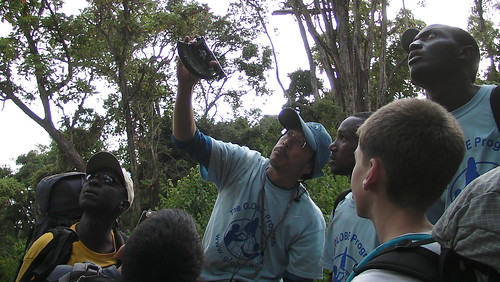
Collecting data in the rainforest

Collecting data in the rainforest

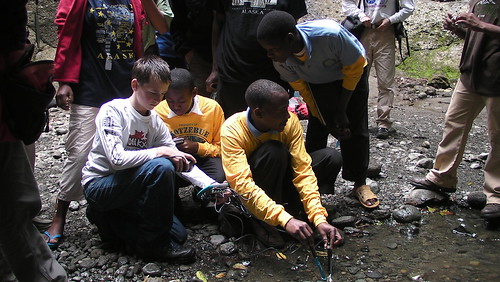
Collecting hydrology data

Collecting hydrology data

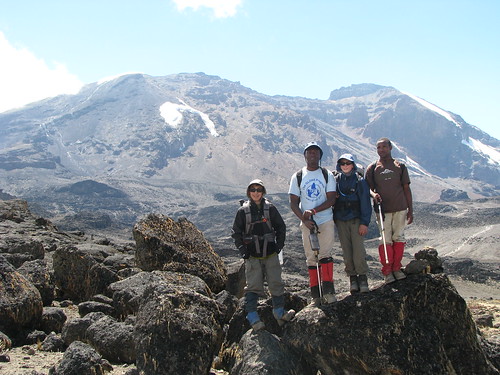
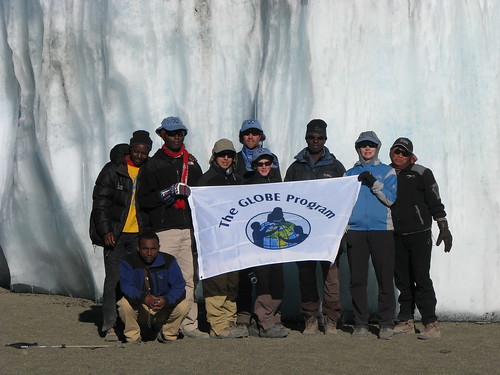
Taking a break to pose in front of the summit

Taking a break to pose in front of the summit

Taking a picture at the summit with one of Kili's glaciers

Taking a picture at the summit with one of Kili's glaciers

To reflect on their experience, the bloggers were asked: Looking back to the beginning, you discussed your personal and scientific expectations for The Xpedition.  Summarize your experience with respect to those expectations. How do you envision your experiences during the trek to influence your scientific or educational activities in the future? And how has this trek further cultivated your love of learning?

Maddy

To say that this trip has changed my life is no understatement. I expected to be blown away by the science, culture and challenges along the way… my expectations were anthills in comparison to what Kili delivered! It was phenomenal–simply incredible. The main way I’ll be able to carry Kili with me in my scientific/educational activities in the future is by sharing stories. I learned an extraordinary amount about the culture and history of Tanzania, science of Kilimanjaro, climate change and globe protocols in general. All of our guides were so knowledgeable… botanists, biologists, astrologists and survivalists wrapped into one person (and comics too… they sure got me a few times!). I can’t wait to pass what I learned along to my peers and teachers! I know I’ll easily be able to apply something I learned on Kili to my life here every day.

On our second to last day, I was walking down the mountain with Art (a photographer) and John. We were chatting about all the incredible places they’ve both visited, and at one point they said “the problem with traveling is the more you see, the more amazing things you discover, and the more you want to see!” I couldn’t have said it better: now that I’ve seen the beauty of Tanzania, met some incredible people, and learned about the very unique science behind the mountain… I just want to get back out there and do it all again!

John

My personal expectations were well exceeded!  The land and the people of Tanzania have been so diverse and interesting that it has been very easy to feel comfortable in this place.  All of the porters and guides have been friendly and eager to learn and to share their knowledge.  They have helped me discover the beauty of life in Africa as well as the balance of the land and animals.

From a science perspective, it was a great learning experience to follow the researchers in making observations and looking at the data from the streams.  This information is not only important to the biomes and habitats on the mountain, it also applies to the people and crops that live around the base of Kilimanjaro and depend on the rivers and streams.

With this new knowledge I will find various ways of bringing the information into the lessons and activities the students will learn.  From a geological aspect, the volcanic history and landscape of Kilimanjaro provides similarities as well as contrasts to our Southern California past.  This will also include looking at the tectonic action and making connections in both locations.  When looking at the wildlife in Africa, comparisons can be made with the flow of energy and the adaptations in the organisms that occupy both regions.  The African flora and fauna also provide a new and interesting set of creatures and plants that are familiar and fun for the kids to learn about.

Seeing Africa for the first time has really excited me toward learning more about the natural world outside of my own region.  There is so much diversity covering a huge number of plants and animals.  By seeing these factors first hand, and witnessing the daily activities on the Serengeti and Mt. Kilimanjaro, it is easy to see how bring this new information to the students will help in adding motivation to my learning and teaching goals.

From The GLOBE Program Office, we hope you have enjoyed reading along with our series from Mt. Kilimanjaro as much as we have writing it and passing it on to you.  Thank you to our team who worked hard to bring us their experience from the mountain as well as for collecting important data that will help us understand even more our environment.

Posted in Climate, Climate Change, Earth System Science, Seasons and Biomes | 3 Comments