Mosquitos – carriers of the dangerous Dengue virus

This week we have a guest blog from Dr. Krisanadej Jaroensutasinee and Dr. Mullica Jaroensutasinee from the Centre of Excellence for Ecoinformatics at Walailak University in Thailand.  The research they are presenting in this blog is also done with Dr. Siriwan Wongkoon, also from the Centre of Excellence for Ecoinformatics at Walailak University and Dr. Elena Sparrow with the International Arctic Research Center at the University of Alaska, Fairbanks.

Dengue is a serious public health problem in the tropical regions, particularly in Thailand. World Health Organization (WHO) estimated that about 50-100 million cases of dengue are recorded all over the world annually and two-fifths of the world population are at risk. More than one hundred countries have been affected by dengue or Dengue Hemorrhagic Fever/Dengue Shock Syndrome (DHF/DSS) epidemics. Indonesia, northern Australia, Central and South America, Southeast Asia, Sub-Saharan Africa, and some parts of the Caribbean have seen cases of this disease.   Dengue fever is characterized by a sudden, high fever.  A rash appears a few days after the fever has set in, and may also be accompanied by headaches, muscle and joint aches, and digestive upset.

Image of a mosquito

A mosquito - from Wikicommons

In Thailand, dengue epidemics of increasing magnitude and severity occur every two to four years beyond the endemic levels. An endemic is when an infection is maintained within a certain population.  Although dengue occurs throughout the year, cases peak from June to August, the wet season in Thailand. Neither a vaccine nor specific treatment for dengue fever is available. Vector control, which is the method in which mosquitoes are limited or eradicated, seems to be the most possible solution to prevent dengue transmission. Mosquito population dynamics are not the same in different geographical regions where dengue is transmitted suggesting that the influence of climate on dengue may be site specific.

As a mosquito-borne disease with a seasonal distribution, environmental factors, including weather variables, may play a significant role in the transmission of dengue. Temperature, rainfall, and relative humidity are major parameters influencing the incidence of dengue fever in Thailand. The prediction of global climate change and transmission of dengue and its geographic spread has been widely studied. Since dengue transmission is highly dependent on local environmental factors, it may not be possible to predict incidence outside locations with extensive valid data. However, investigations of local weather conditions and dengue incidence in different environmental and regional contexts can improve our understanding of the linkages between weather variables and dengue transmission, as well as provide strong scientific evidence for predicting future transmission patterns.

Monitoring of mosquito larvae, finding mosquito larval indices, and predicting dengue incidence can facilitate early warning and disease control and prevention. We developed Thailand mosquito protocol and the Mosquito Web Database System (MDS). The MDS provides an essential tool for querying, analyzing and visualizing patterns of mosquito larvae distribution in Thailand. MDS was developed using Structured Query Language (SQL) technology as a web-based tool for data entry and data access, webMathematica technology for data analysis and data visualization and Google Earth™ for Geographic Information System (GIS) visualization. The MDS prototype is available online at http://www.twibl.org/mosquito.  The following images show screen captures of this web-based data entry system.
A screen capture of the mosquito web database home page

Mosquito web database home page

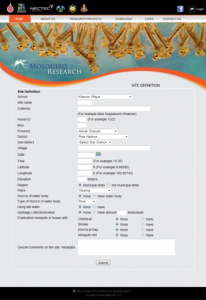
Screen capture of the data entry suite: site definition containing socio-economic data

Data entry suite: site definition containing socio-economic data

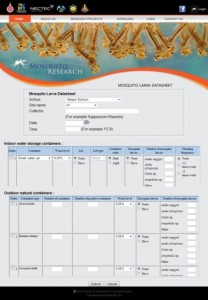
A screen capture of the data entry suite: mosquito larva datasheet containing data of mosquitoes in both indoor and outdoor water storage containers

Data entry suite: mosquito larva datasheet containing data of mosquitoes in both indoor and outdoor water storage containers

As a mosquito-borne disease with a seasonal distribution, environmental factors, including weather variables, may play a significant role in the transmission of dengue. Temperature, rainfall, and relative humidity are major parameters influencing the incidence of dengue fever in Thailand. The prediction of global climate change and transmission of dengue and its geographic spread has been widely studied. Since dengue transmission is highly dependent on local environmental factors, it may not be possible to predict incidence outside locations with extensive valid data. However, investigations of local weather conditions and dengue incidence in different environmental and regional contexts can improve our understanding of the linkages between weather variables and dengue transmission, as well as provide strong scientific evidence for predicting future transmission patterns.

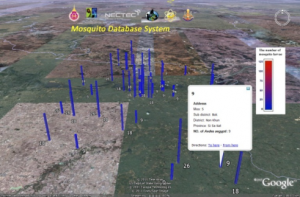
Twelve selected schools in Thailand provided test data for MDS. Users performed data entry using the web-service, data analysis and data visualization tools with webMathematica, data visualization with bar charts, larval indices, and three-dimensional (3D) bar charts overlaying on Google Earth™. The 3D bar charts of the number of mosquito larvae were displayed along with spatial information. These Google maps and mosquito larvae information should be useful to the dengue control and health service communities for their planning and operational activities.  An example of the 3D bar chart is shown in the following image.

GIS tool displaying the number of mosquito larva distribution in 3D bar charts on Google Earth

GIS tool displaying the number of mosquito larva distribution in 3D bar charts on Google Earth

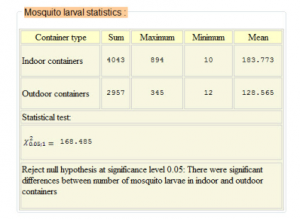
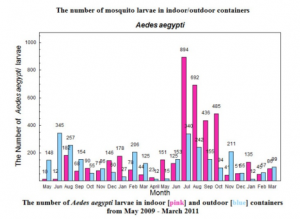
In addition to using 3D charts, the system also provides statistical information on mosquitoes as well as basic charts showing the number of mosquito larvae in indoor and outdoor containers.
A screen capture of the statistical tool showing max/min/mean and results from the Chi-square

A screen capture of the statistical tool showing max/min/mean and results from the Chi-square

A screen capture of the graphic tool displaying the monthly mosquito larvae in indoor and outdoor containers

A screen capture of the graphic tool displaying the monthly mosquito larvae in indoor and outdoor containers

Are mosquitos a problem in your area?  Have you done any research connecting atmospheric variables to mosquito populations?  Send us an email at science@globe.gov or add a comment to let us know about your research!

Posted in General Science | 5 Comments

Trees in Trouble: Climate Change and Pine Beetles

This post is the second in a series called “Trees in Trouble”.  To see the first post in this series click here.

Climate impacts so many things on this planet, most notably the types of flora and fauna that live in a specific region.  And for those creatures that have annual cycles tied to the local climate, such as the hibernation of bears, migration of birds, and life cycles of insects, a change in climate can shift their way of life and even have subsequent consequences on the environment they live in.

Take the pine beetle (Dendroctonus ponderosae) for example.  In order to deposit her eggs, a female pine beetle digs a burrow deep into a pine tree.   Pine beetles also carry a fungus with them that gets introduced to the tree during the attack. This fungus is what the larvae feed on during winter, however it is this fungus that kills the tree.  Thus, once the beetles have targeted a pine tree, its fate is almost certainly doomed.

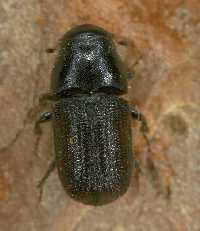
Photo of pine beetle

Top view of an adult mountain pine beetle (actual size is 1/8 to 1/3 inch). (From Colorado State University Extension Office)

While the pine beetle is native in the pine forests of North America, this past decade has seen its population increase tremendously.  What else has been noteworthy of this past decade?  It has been an incredibly hot period, relative to our historical records.  One symptom of this climate change in places like the Rocky Mountains of North America has been an earlier onset to summer, after notably warm and mild springs.

Drier and hotter summers impact the health of the pine trees, leaving them weak and vulnerable to attack by beetles.  Additionally, recent research has shown that when unseasonably hot weather occurs in early summer, pine beetles emerge from their larvae nests in pine trees much earlier as well.  So much earlier, in fact, that they were even observed to have a second reproductive cycle yielding more adults later in the summer, resulting in two waves of beetles capable of attacking, and thus killing, pine trees in just one summer.  Moreover, the warmer climate also allows the beetles to escape their most natural form of population control: fall and spring hard freezes or sustained periods of extremely cold (< -35 C) temperatures in winter.

Photo of pine beetle effects on a pine forest

Example of damage from pine beetle infestations in trees in Rocky Mountain National Park (taken January 2012, from Wikimedia Commons). Infested trees initially turn red and then eventually lose all of their needles, leaving them appearing gray in color.

The increase in pine beetle populations due to climate shifts certainly could be one of the reasons for the epidemic tree loss currently facing the Rocky Mountain pine forests.  While there are some methods to control the spread of the pine beetle, many are labor intensive or not as effective when the outbreaks are occurring.  Thus, it is hard to say what the future holds for the mountain pine forests and the ecosystems within which they reside.

Suggested Activity: Participate in the GLOBE Student Climate Research Campaign (SCRC) Climate and Land Cover project to help document how the forests in your region are changing!  During four Intensive Observing Periods (IOPs) each year, GLOBE students use the land cover protocol to take photographs of land cover near their schools and upload these data to the GLOBE database.  The April Climate and Land Cover project IOP is currently underway.  We would love to see photographs of what is happening to the forests in your region!  Send us an email at science@globe.gov or add a comment to let us know what you observe.

–Sarah Tessendorf


Posted in Climate, Climate Change, General Science | 1 Comment

Melting glaciers in Chile – washing away valuable data

Many of the world’s glaciers, such as the Exit Glacier in Alaska, United States and Pasterze Glacier in Austria, have lost mass due to melting over the past few years. One such glacier, Exploradores in southern Chile, is also disappearing. This glacier is a sight to behold – a 20 kilometer frozen mass that is filled with cliffs of luminescent blue and indigo ice.

A view from inside the Exploradores Glacier

A view from inside the Exploradores Glacier, from Nature

The Exploradores Glacier is one of many glaciers in the Patagonian Ice Fields located in the Andes Mountains between Argentina and Chile.  This and many of the other glaciers in this region, such as the San Rafael and Jorge Montt, are retreating. Glacier retreat is one of many visible signs of climate change.

Map of the Patagonian Ice Fields

Map of the Patagonian Ice Fields, created by Hugo Ahlenius, UNEP/GRID-Arendal

While there is no question that the glaciers are retreating, there is an uncertainty as to the cause of the retreat.  Scientists all over the world are looking to the Patagonian Ice Field for answers.  In an article featured in Nature, Chilean and British scientists discuss the glacier melt.  Some of these scientists have been visiting the glacier to collect important data, like temperature, precipitation, humidity and wind speed, to evaluate the health of the glaciers.  Connecting these weather variables to glacier recession is an important task, and will help answer the questions of how quickly the glaciers are disappearing and how that will affect local water supply.  While I’ve only named three glaciers in the region, there are over 100 in the Patagonian Ice Field that are being monitored.

Of the 100 glaciers being monitored for their weather conditions, nearly 90% are retreating.  It is estimated that since 1650, over 600 cubic kilometers of ice have melted between the northern and southern regions of the ice field, with the rate speeding up in recent decades.  This is concerning because of the fresh water on the earth, about 75% of it is found in glaciers.  If glacier melt continues, there could be major consequences.  A reduction in fresh water supply, loss of habitat for animals and plant species, and excessive flooding are just three problems we could face if these glaciers continue receding.  It is worth noting that glacier recession is normal, but what is concerning is the rate of recession.  If the rate of recession doesn’t slow down, we’ll see not only these beautiful landscapes disappear, but with it valuable paleoclimate data found in the ice.  We’re literally seeing data washed away through melt runoff!

While you may not be able to study glaciers as a GLOBE school, the research done by these scientists show a method for connecting local weather to climate.  How can you, as a GLOBE school, connect your local weather to climate?  This is a very important aspect of the Student Climate Research Campaign!  We’d love to hear your thoughts – send us an email at science@globe.gov or leave a comment!

­-Jessica Mackaro

Posted in General Science | 3 Comments

From drought to flood down under: Part II–When it rains, it pours

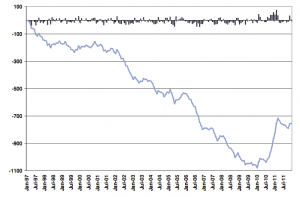
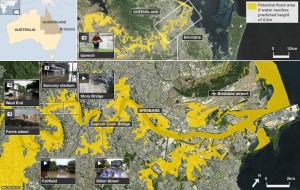
Just over four years after my first visit to Australia (From drought to flood down under: Part I), the tides have turned and the country has gone from experiencing the driest decade on record to having the wettest two-year period on record in 2010-2011.  These recent rains have been both a blessing and a curse.  The good news is that they helped the region of southeastern Australia start to recover from the long drought (see Figure 1).  The bad news is that the rains came on heavy and strong.  In January 2011, devastating floods occurred across southeastern Queensland, including in its capital city of Brisbane (Figure 2).  Flash floods even wreaked havoc in communities like Toowoomba and the Lockyer Valley.  Then in February this year, flooding returned to southeastern Queensland as well as other parts of Australia, resulting in more devastation.

Time series of rainfall anomalies in Australia

Figure 1. Cumulative rainfall anomalies (in mm) for southeastern Australia from 1997 to December 2011. Individual monthly anomalies are shown by the bars at the top of the figure. (From BOM)

Map of potentially flooded areas around Brisbane, Australia

Figure 2. Map of potentially flooded areas in southeast Queensland and the capital city of Brisbane (From BBC)

What a change for this region to have gone from being so close to running out of freshwater to being inundated with it!  What is happening?

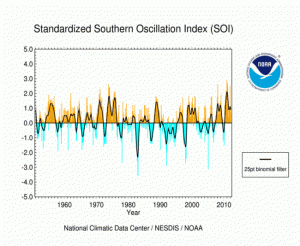
Well, this region has a very strong link to the El Niño Southern Oscillation (ENSO).  When ENSO is in an El Niño phase, the region experiences drier conditions than when ENSO is in the La Niña phase.  La Niña brings warmer sea surface temperatures and associated enhanced convection to the eastern Australia coastal region, thereby inducing wetter weather.  The ENSO phases are measured by the Southern Oscillation Index (SOI), and it just so happens that the past two years have had record positive SOI (indicative of the La Niña phase) and record sea surface temperatures (Figure 3).  In fact, the previously notable record flood in Brisbane occurred in 1974, which also happened to be another very positive phase in the SOI.

Time series of the Southern Oscillation Index for the period of record

Figure 3. Southern Oscillation Index (SOI) for the period of record. Positive values indicate La Niña episodes. (From NCDC)

While it seems extreme, dramatic shifts from droughts to floods are actually part of the foundation of this country, as rhythmically described by Dorothea Mackellar in her 1908 poem “My Country” (Click here for full poem):

I love a sunburnt country,
A land of sweeping plains,
Of ragged mountain ranges,
Of droughts and flooding rains.
I love her far horizons,
I love her jewel-sea,
Her beauty and her terror -
The wide brown land for me!

However, with population increasing, more water is needed for human consumption, crops, and industry, while too much water damages the growing communities and vital croplands.  Managing these extremes is not an easy task, but is a necessity to continue building the Australian way of life.

Suggested activity: Look for cycles in precipitation patterns from one year to next and over several decades with long-term precipitation data and compare these trends with climate indices, such as the SOI to see if there are any ties to ENSO in your region.

-Sarah Tessendorf


Posted in General Science | 3 Comments

Do’s and Don’ts – The Climate and Land Cover Intensive Observing Period

A fun and easy way to be involved in the Student Climate Research Campaign (SCRC) is by participating in the Climate and Land Cover (CLC) Intensive Observing Period (IOP).  This quarterly IOP focuses on documenting and uploading land cover data into the GLOBE database.  Scientists are then able to use these data to validate land cover in climate models.  Knowing the right type of land cover is important to climate models, because it plays a role in both the energy and hydrologic cycles.  For example, land cover plays an important role in how much solar energy is absorbed or reflected from the surface of the Earth, and how much water evaporates into the atmosphere depending on land cover or vegetation type.

In June of 2011, I discussed the CLC in a bit more detail, and featured a video from Dr. Sandy MacDonald discussing the importance of student-collected data.  The April 2012 IOP has just begun, so I thought it would be a great time to discuss even more details about how to participate – a list of “do’s and don’ts”.

  1. Do find a representative land cover site.  A representative site is one that is not only a homogeneous area, but also one that represents the area where you live.  To choose a representative land cover site, Google Earth provides satellite imagery around the world.  Google Earth can be downloaded here.
  2. Don’t choose a site just because it’s attractive or convenient.  Whether you live in an urban area or a rural agricultural area, it’s as important to capture both land cover types.  Don’t choose a city park because you think it would make nice pictures.
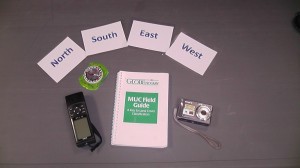
  3. Do have all of your materials ready when you head out to a site.  This includes a GPS device, compass, camera, MUC Field Guide, and signs for the cardinal directions, as well as a notebook and pencil to take notes.

    An image of the materials needed for the Climate and Land Cover Intensive Observing Period

    The materials needed for the CLC

  4. Don’t take pictures before using your compass to check the cardinal direction.
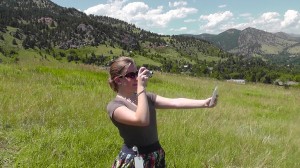
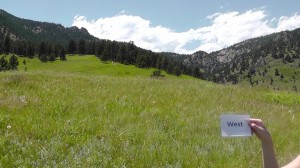
  5. Do take a picture in each of the four cardinal directions adding a small sign in a bottom corner showing the direction.

    Student Scientist Emily capturing a land cover photo

    Student Scientist Emily showing how to take a land cover photograph

  6. Don’t let the cardinal direction sign obscure too much of the view of the landscape in your photo.

    An example of a proper land cover photo

    An example of a proper land cover photo

  7. Don’t submit photos to the GLOBE database with students in the pictures. While it’s fun to take photos of classmates participating, it will not help our scientists. However, if you’d like to submit a photo of your class participating, please email them to science@globe.gov. We are always looking for images of students collecting data*!
  8. Do double check your data entry to make sure you’ve entered the correct date on which your photos were taken (and not the date you’re entering them into the GLOBE database).
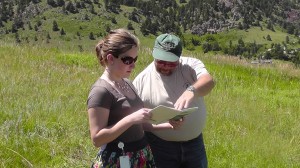
  9. Do have your students discuss together the type of land cover at their site. Not only does this ensure the correct MUC classification, it encourages students to discuss the project!

    Discussing land cover types

    Student Scientist Emily and GPO Staff Member Gary discussing the MUC classification for their land cover site

  10. Don’t hesitate to contact the GLOBE CLC team (landcover@globe.gov) if you have any questions or need help finding a good site or uploading your data.
  11. Do check out land cover photos submitted by other schools. This is a great way to explore climate in other locations in your own country and across the world!
  12. Do have fun! The CLC is a great and easy way to get students outside exploring the world around them!

It is important to note that only GLOBE schools can enter Land Cover data. If you’re not a trained GLOBE school and you’d like to be involved in this IOP, please email help@globe.gov and we will put you in touch with a nearby partner. If participation in April is difficult, the IOP will repeat in July! If you’ve been participating in past IOPs, we thank you! We’d love to hear about any changes you’ve seen in your land cover site! Please leave us a comment or email us at science@globe.gov!

-Jessica Mackaro

*If you do submit a photo of your students participating in the CLC, we will follow-up with you in order to obtain a photo release form.

Posted in General Science | 1 Comment