Sharing What You Have Learned – Science Fairs

Last week’s GLOBE Scientists’ blog, “Peculiar weather – just because it sounds odd doesn’t mean it didn’t happen!” talked about inquiry-based learning.  If you have a great question and decide to investigate further, how can you share your results?  Sharing results is an essential part of the scientific method.   If scientists didn’t share their work, how would we know what has already been done?  Or what is already known?  One of the best options for young scientists to share results is to participate in a science fair.  Science fairs often occur in the spring, so if you haven’t already started, now would be a great time to think about a project.

If you decide to do a science fair project, Jennifer Cutaro of Science News for Kids recommends getting the whole family involved.  Her article, “Science fair as a family affair”, addresses talking as a family about interests, places to go for inspiration, and ways the whole family can help young scientists complete a research project.   As all scientists know, there can be setbacks along the way.  Support from your family can help get you through difficult patches and you can all learn something along the way!

Need more inspiration?  A recent GLOBE Star, Justas Sidiskis of Lithuania, won second prize in the European Union Contest for Young Scientists.  He studied clouds, precipitation, and temperature using GLOBE data for his area and the GLOBE Atmosphere protocols. There are many other GLOBE protocols, which might also give you some ideas!

Justas Sidiskis

Now, where to find a science fair?  Many schools offer science fairs, but if your school doesn’t have one, you can still share your project.  The Google Science Fair is open to students ages 13-18 from all over the world.

GLOBE Students in the past have had amazing science fair projects.  Three GLOBE students and their teacher from Ohio were recognized at the White House in 2010 for their outstanding achievements. Just think what you could do!

Tiffine Guindon, Tazhianna Dean, and Alexandra Carey with their teacher, Melody Tsapranis

Are you using any GLOBE protocols or GLOBE data for a science fair experiment?  Let us know through comment or email!

-JSM


Posted in General Science, GLOBE Protocols | Leave a comment

Peculiar weather – just because it sounds odd doesn’t mean it didn’t happen!

I have always been passionate about the weather.  When I realized that to fulfill this passion I had to have a career in atmospheric science, I started acquiring all sorts of books, charts, movies, and other weather related things.  One of those books was a book from the early 1990’s called It’s Raining Frogs and Fishes by Jerry Dennis.  It was really interesting to me because it discussed all of the different seasons and some different phenomena that different parts of the world experience during the seasons.  As I continue to blog for The GLOBE Program, my mind keeps returning to this book because I remembered some really interesting facts that I thought would be fun to share with the GLOBE community.

The first topic I wanted to address was the title of the book, because it is a very interesting idea.  As it suggests, at different times during history, there have been times that frogs and fish have been seen in locations that couldn’t be explained.   Maybe your grandparents have told you a story about something similar that you couldn’t believe could be true.  It is important for you to use your knowledge to come to a conclusion before you accept it as true or false.

A cartoon of raining frogs
Cartoon of raining frogs, from listsoplenty.com

In 1921, a paper was published entitled “Rains of Fishes” that documented hundreds of years of accounts of fish falling from the skies.  The accounts documented in this paper range from the city streets of New York to rural Indiana.   The author of the paper proposed quite a few methods for the fish to fall from the sky, such as witnesses observing species of fish that actually can migrate over land or that the fish had been lifted from a nearby ocean, lake, or stream.  As with controversial topics, skeptics began to question the findings in this paper and wrote their own versions.  It wasn’t until 1947 when a biologist in Louisiana witnessed for himself a rain of fish and reported it in Science magazine.

In addition to these locations in the United States, there are reports of fish falling from the sky from India, Scotland, and Greece.   Even with multiple countries reporting such events, it still isn’t clear if these fish are actually falling from the sky after having been picked up by a severe weather event, or if there is another explanation for it.

But it’s not just fish that have been reported.  Frogs, hazelnuts, and grain have also been observed falling from the sky.  These reports come from the United States, Germany, Ireland, India, and China.  Like the fish rain, these reports are harder to explain, especially when associated with clear skies.  In 1989, a frog swarm was seen prior to the Loma Prieta earthquake in California.  While some wondered where these frogs came from, it is thought that their intuition had them move before the earthquake hit.  This was also seen in 2008 prior to the Sichuan earthquake in China.

2008 frog swarm in China
2008 frog swarm in China, from weirdasianews.com

As with all phenomena that aren’t intuitive, it is interesting to take a look at all of the factors to find an explanation that can be based on facts.   In the case of fish, was there a flash flood that may have brought the fish onto land and left them there when the waters receded?  Was there a tornado or water spout that may have deposited the fish on land?  Or was it a species that is known to migrate over land occasionally?

This idea is the vision of The GLOBE Program – promoting and supporting teachers, students, and scientists to promote inquiry-based study and research.  Have you used inquiry to answer a question that didn’t make sense?  We’d love to hear about it! Let us know through a comment or email!

Posted in Backyard Science, General Science | 3 Comments

Songbirds and farm health – what’s the connection?

When you think about farms, you may think of the sounds you hear.  Those sounds may include both natural and manmade sounds, such as the rustling of produce in the wind or machines working the fields.  While these are expected sounds that can indicate farm health, scientists recently have been looking at another natural sound: songbirds.

Farmers are becoming more interested in looking at the key connections between ecological, economic, and social components to managing their farms, according to Quest science blog.  It is then important to make sure that clear and easy to follow diagnostic tools are established for farmers to use.  Creating diagnostic tools is the focus of new research out of the University of Nebraska-Lincoln.  These tools, known as the Healthy Farm Index, focus on biodiversity and ecosystems at the farm scale.  One indicator in this index is the presence of songbirds.

Why birds?  Birds are very sensitive to small changes in farm practice, are found all over the environment, and are easy to detect by both sight and sound.  Researchers have been recording and analyzing bird calls to provide them to farmers, which will enable them to listen for the common birds while they’re out in the fields.  These songs are then archived on the university’s web site.  You can even listen to the different bird songs and calls by visiting the site yourself .  Have you heard any of these calls before?

A couple of the birds whose calls are archived on the site include the Bobolink, a beautiful little black and white bird with a yellow head

Image of the Bobolink

Bobolink: Image from allaboutbirds.org

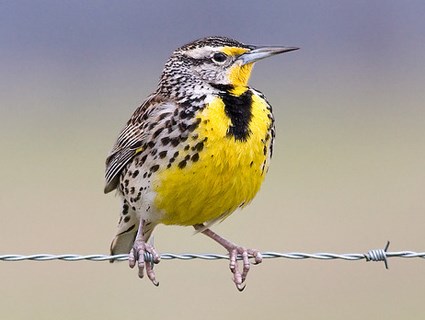
and the Western Meadowlark, a white and black spotted bird with a yellow chest.

Image of the Western Meadowlark

The Western Meadowlark, from allaboutbirds.org

More research is being done through the winter months to find which birds are present and how they can be related to the Healthy Farm Index.

While this study does not indicate the importance of migration for these selected birds, it could be of interest to look at the migratory patterns of the birds that The University of Nebraska-Lincoln has identified as key indicators of farm health.  Schools in and around the Lincoln, Nebraska area could use the list of birds provided on the university’s website along with the Arctic Bird Migration Monitoring Protocol to see if there are any changes to the arrival and departure dates of these farm birds.  Schools in other parts of the world could work with local scientists to find birds that are similar to the ones used in the University of Nebraska Lincoln study to monitor birds in their location.

Are you a GLOBE school looking at bird migration?  If so, we’d love to hear from you!  Leave us a comment or email us!

-jm

Posted in General Science | 2 Comments

Nitrogen in remote lakes – a chance for GLOBE schools to use hydrology protocols

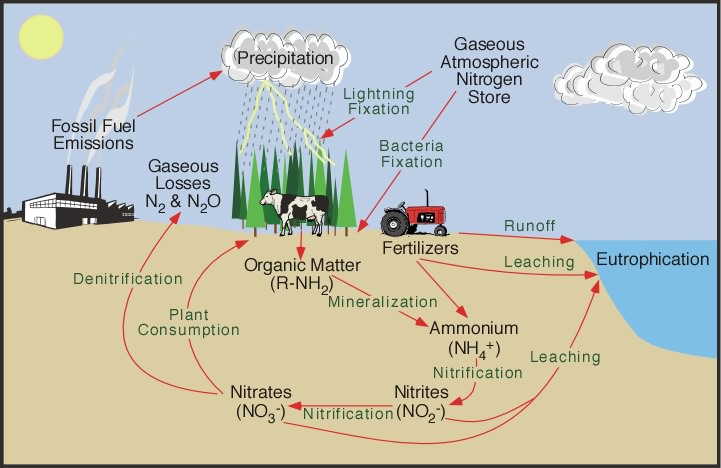
Nitrogen is an important molecule that makes up nearly 78 percent of the atmosphere.  Burning fossil fuels and using fertilizers for agriculture are two ways that this number can increase.  But the atmosphere isn’t the only place that nitrogen is found – it is also found in bodies of water.  Of the nitrogen that is spread in fertilizers, only 25-30 percent is absorbed by plants, so that leaves a lot of nitrogen left to either be absorbed by the atmosphere or into water.  Figure 1 shows the intricacies of the nitrogen cycle, from Physical Geography.net’s Fundamentals E-book:

The Nitrogen Cycle
Figure 1. The Nitrogen Cycle


According to a recent article in Science, most of the studies of nitrogen in bodies of water have been done on a local or regional scale.  These studies focus on how local agriculture and manufacturing effect pollution in water that is used for drinking water around highly agricultural or industrial areas.  This new study takes a look at the nitrogen levels in lakes and ponds thousands of miles away from the nearest city, industrial area, or farm.

How did this nitrogen arrive so far away from cities, farms, or industry?  The study suggests that it is transported through the atmosphere and then returns to the ground through one of the mechanisms of the nitrogen cycle, like precipitation.

While nitrogen is important to life on earth, too much of it can be a bad thing.  Too much nitrogen can cause smog, acid rain, or water pollution.  Each of these negative effects of too much nitrogen can greatly affect living things.  However, since this is such a new study, the effect of this transported nitrogen on the water bodies and vegetation in these remote areas is still unknown.

Nitrogen content in bodies of water is one of the hydrology protocols that GLOBE schools can choose to examine.  By following the protocol, students can start to create a record of how the nitrogen content of water near their communities or school changes over time.  It may then be interesting for students to work with another school in a different location to see how nitrogen is changing in their location.

Are you a GLOBE school using the Nitrate protocol?  If so, we’d love to hear if you’ve seen a change in the amount of nitrogen you’re observing.  Let us know through a comment or an email!

-jm

Posted in General Science | 1 Comment

What exactly is the monsoon?

This week, we have a guest post from Dr. Angela Rowe – a post-doc with Colorado State University and the country of Taiwan examining radar data and monsoons.  Dr. Rowe received her undergraduate degree in meteorology from Millersville University, and her Master’s and Doctoral degrees from Colorado State University, focusing on the Asian and North American Monsoons.  This post is timely, as the monsoon was mentioned in many of the state of the climate of 2010 discussions for different GLOBE regions.

When most people hear the word “monsoon”, thoughts of abrupt, intense rainfall typically come to mind. Although many areas across the world do, in fact, receive the majority of annual rainfall during the monsoon, this term, derived from the Arabic word “mausim” meaning season, technically refers to a seasonal reversal in winds.  During the summer months, the land surface heats up as days become longer and incoming solar radiation increases. In coastal areas, a large difference in temperature develops between the land and the nearby ocean because water has a higher specific heat capacity, meaning it takes more energy to heat up the ocean surface to the same temperature as the land. The warmer air over the land is less dense and, therefore, rises, creating low pressure near the surface with relatively higher pressure over the cooler ocean surface. This pressure difference leads to onshore winds at the surface and a return flow at upper levels (Fig. 1). This mechanism is similar to that described for sea breezes (the cooler winds you feel coming off the ocean while sitting at the beach under the sun), but occurs on a much larger scale. The surface winds bring moist air over the land surface, and if that air can be lifted, whether by being forced up along steep mountains, rising due to surface heating/convection, or from surface convergence (perhaps due to colliding of these onshore winds with downslope winds off mountain ranges), clouds and subsequent rain will form. This is the reason that monsoons are typically associated with an increase in rainfall. In the winter, however, as the land cools off quicker than the nearby ocean, a reverse circulation develops (Fig. 1), resulting in offshore flow and a shift to drier conditions over the land areas.
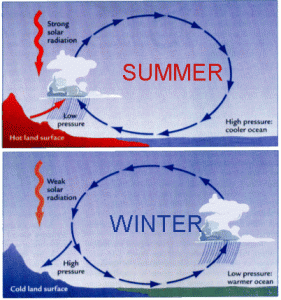
Monsoonal circulation

Fig. 1: Seasonal monsoonal circulation

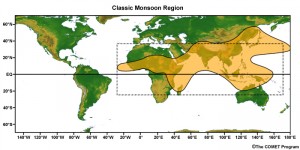
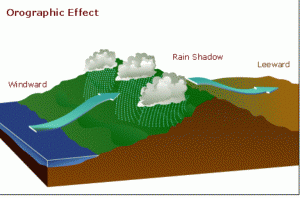
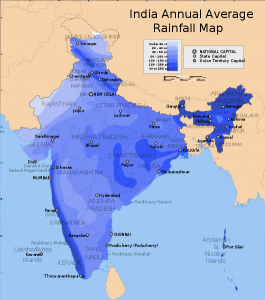
The most well-known monsoon occurs in Asia, where the high elevations of the Tibetan Plateau, extending, on average, over 5000 m in height above sea level (Fig. 2), enhance the temperature difference between land and water. The Asian monsoon influences a large percentage of Asia (Fig. 3), but varies regionally, and is, therefore, commonly described as two separate, but interacting, sub-systems: the Indian Summer Monsoon (or South Asian Monsoon) and the East Asian Monsoon. The first area to receive monsoon rainfall in India is the Western Ghats, where this large mountain range, located along the southwestern coast of the country (Fig. 2), acts as a barrier to the moist winds from the Arabian Sea. The incoming flow is forced up along the western slopes, referred to as orographic lift (Fig. 4), leading to enhanced precipitation as water vapor condenses to form rain-producing clouds along these steep mountains. On the leeward (eastward) side of the mountains, downslope winds lead to relatively drier conditions, referred to as a “rain shadow” (Fig. 4).  This distribution of rainfall can be seen in Fig. 5, where over 250 cm of rainfall is observed annually along the southwestern coast. The other region in India characterized by these large amounts of rain is located to the NE along the Himalayas. As moist air is brought in from the Bay of Bengal, the highest mountain range in the world lifts this air, similar to the Western Ghats, and results in the wettest places on Earth. One of these towns, Cherrapunji, holds the Guinness World Record for most rain in a single year (22 m/75 ft between July 1860 and August 1861) and for most rainfall in a single month (30.5 ft in July 1861). While more recent years have not seen quite these record-breaking amounts, the average yearly rainfall is typically around 12 m, with the majority falling during the summer monsoon months of June and July.
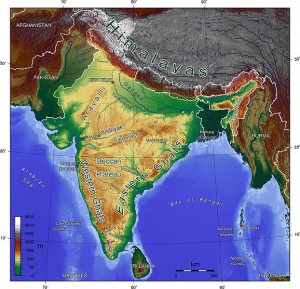
Map of India

Fig. 2: Topographical map of India

Map of the monsoon region

Fig. 3: Map of the monsoon region

Image of a rain shadow

Fig. 4: Image of a rain shadow

Rainfall distribution over India

Fig. 5: Rainfall distribution over India

As the summer months progress, the moist, onshore winds associated with the monsoon impact nearby regions to the east over the Indo-Chinese peninsula. Along with India, most of these regions rely on the monsoon rainfall for crops; therefore, any changes in the onset and intensity of the monsoon could greatly impact agricultural production.  The monsoon season this year has been particularly difficult for Thailand, with rainfall amounts around 1800 mm (28% above normal) for 1 January to 31 October (with over 200 mm of that alone in October), leading to devastating flooding (Fig. 6) and impacting nearly 25% of this year’s rice crop.  Damages were estimated at 45 billion USD, making it the world’s fourth costliest disaster, and over 500 deaths were reported.

Image of India flooding

Fig. 6: Image of India flooding

The monsoon season over East Asia is even more complex, due to more complicated distributions between land and water and more localized mountain ranges. Precipitation in this region tends to form along bands, or fronts, referred to as Mei-Yu in China and Taiwan, Baiu in Japan, and Changma in Korea. This rain belt moves northward throughout late spring/early summer, beginning in the South China Sea in May. Large rain-producing weather systems form along this front, leading to heavy rainfall, influenced by the mountains in these regions due to orographic lift. These monsoon conditions also increase the probability of tropical storm formation, which, at times, can interact with the monsoon flow with devastating results. One such example occurred during the monsoon season in 2009 in Taiwan, when Typhoon Morakot, combined with the moist, monsoon flow, produced record-breaking rainfall with 72-hour rain totals exceeding 3000 mm and lead to landslides (Fig. 7) and hundreds of deaths.
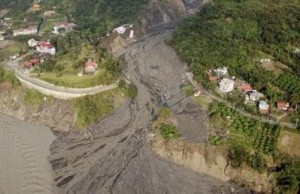
Image of a mudslide

Fig. 7: Image of a mudslide in Taiwan

As the onshore winds associated with the Asian summer monsoon switch to offshore, due to the cooling of the land surface, the Australian monsoon, the seasonal opposite of the Asian monsoon, begins to take effect. The monsoon rainfall begins over Malaysia during late August, moving over northern Australia by early February as this region begins to heat up relative to the nearby ocean and winds shift to onshore (Fig. 8). This region usually experiences several monsoon events, or “bursts,” over the next few months, with periods of intense rainfall that contributes more than three-quarters of the annual rainfall in this region.
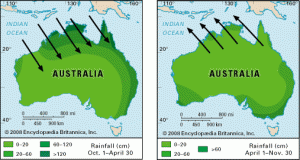
Schematic of the Australian monsoon

Fig. 8: Schematic of the Australian monsoon

Although the monsoon systems in the eastern hemisphere are the most well-known and intense, the Americas also experience a seasonal shift in winds that lead to enhanced precipitation along coastal regions. More specifically, the North American monsoon develops in northwestern Mexico and the southwestern U.S. as the elevated deserts become warmer relative to the nearby Gulf of California. A corresponding wind shift occurs during late June, leading to moist, onshore flow that is lifted by the steep mountains in this region (Fig. 9). This rainfall leads to a drastic change in vegetation in northwestern Mexico can be observed in only a couple of weeks (Fig. 10) and accounts for the majority of annual rainfall throughout most of this region. In the desert southwest of the U.S., flash floods are a major hazard resulting from this short-lived, yet intense rainfall.
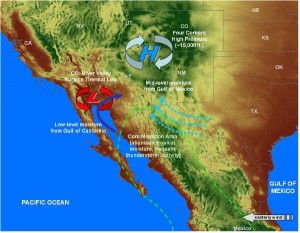
Schematic of the North American monsoon

Fig. 9: Schematic of the North American monsoon

Benefits of the North American monsoon

Fig. 10: Before and after: Benefits of the North American monsoon

Whether in the desert cities of the southwestern U.S. or the small villages along the Himalayas, rainfall associated with monsoon systems have a major impact on those living in these regions. This water is crucial for an otherwise dry area, accounting for the majority of annual rainfall and therefore required for drinking, growing food, etc. However, as was clearly displayed this year in Thailand, too much rain during the monsoon season can lead to devastation and loss of life, emphasizing the need to improve prediction of the timing and intensity of the monsoon systems across the world.

As a GLOBE school in one of these regions, have you experienced the monsoon?  We’d love to hear about it!  Leave us a comment or share your story through email at science (at) globe (dot) gov.

Posted in General Science | 25 Comments