Global Climate Change – New Deal Met in Durban, South Africa

In December 2009, Dr. Donna Charlevoix, of the GLOBE Program Office, attended the COP-15 (15th meeting of the Conference of Parties) meeting in Copenhagen, Denmark.  Dr. Charlevoix gave a great summary of the meetings in five separate blog posts that began on 7 December 2009.  Some of you may have read these posts, and for those of you who haven’t, I encourage you to visit them, beginning with the first to get a better understanding of the importance of these annual meetings.

This year’s meeting was titled COP-17 (17th Conference of Parties).  The meeting is important because it includes things such as the adoption of the conference agenda, election of new officers, and reports from committees within the COP.  These meetings are held annually, because it is important to frequently assess progress in dealing with climate change.  After decisions are made at this meeting, a detailed set of rules are created for practical and effective implementation of the Convention.

As in 2009, a lot of the discussion centered around the Kyoto Protocol. The Kyoto Protocol is a binding agreement of 37 industrialized countries to reduce their greenhouse gas emissions.  This protocol was adopted in 1997 in Kyoto, Japan, and entered into force in February of 2005.  There is more information on this important international agreement on the United Nations Convention on Climate Change website.  This year’s conference officially ended on 9 December; however, the final package of agreements, now known as the Durban Platform, wasn’t finalized until the next morning.  This package is very important to the future of regulating climate change.  But what makes this package different than the Kyoto Protocol?

This new package of agreements is a legally-binding treaty of all 194 member governments of the United Nations Framework Convention on Climate Change by limiting greenhouse gas emissions. While this is an exciting advancement, there still are questions to be answered, such as how will this translate into actual reductions in greenhouse gases? When will this go into effect?  The hope is that all negotiations on how to reduce emissions will be decided by 2015 and enforced by 2020.

Another difference from the Kyoto protocol is that the United States, India, and China all agreed to be held accountable for their greenhouse gas emissions.  And while there are items in the agreement that countries don’t agree on, the overall package is important to keep the world focused on climate change mitigation.

So how does this apply to GLOBE schools?  For GLOBE schools looking at the aerosol protocol, it would be interesting to collect data over the next few years to see if there is any change in the optical thickness of the atmosphere (remember the optical thickness is how much of the sun’s light is absorbed or scattered by particles suspended in the atmosphere) and how it corresponds to the enforcement of these new agreements.

How do you think the Durban Platform will affect your location?   Have you been using the aerosol protocol to take measurements that could be used to monitor the changes that the Durban Platform may cause?  We’d love to hear from you!  Please leave us a comment or email us at science (at) globe (dot) gov.

-jm

Posted in General Science, Scientists | 1 Comment

Porpoises in the San Francisco Bay – an example of how a small change can have big results!

Sometimes in a rapidly changing world, it is difficult to see the effects that small changes in human lifestyle can have on not only climate, but on ecosystems.  Various countries and international organizations are working to pass legislation to ensure change.  One such case of legislation working is being observed in the San Francisco Bay – the return of harbor porpoises.  This was recently reported in the QUEST biology blog.

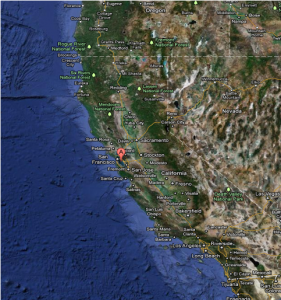
The map below shows the location of the San Francisco Bay, marked by the bubble with an A, from Google. Map of the San Francisco Bay In 1972, the Clean Water Act was passed, working to improve the quality of water bodies within the United States by regulating the pollutants that were dumped into the ocean.  The quality of the water in the Bay began diminishing in the early 1900’s.  During World War II, the San Francisco Bay became a large war time port and ship building center.   By the time of the 1950’s and 1960’s, the Bay was so polluted that it literally smelled like raw sewage.

So when and why exactly did the porpoises leave the Bay?   The answer isn’t exactly clear.  From bone records found in the Bay, porpoises have made this location a home for hundreds of years.  As late as the 1930’s, there were reports of porpoise sightings.  But in the last 70-80 years, these reports were fewer and far between. Approximately three years ago, the first porpoises were spotted returning to the Bay.  Since then, Jonathan Stern,  a whale researcher from San Francisco State University who was featured in the QUEST article, and other researchers have been looking to find the answers to why they left in the first place, and what has caused them to return after so many years.   According to Stern, even though the Clean Water Act was passed in 1972, it takes awhile for the food supply to return, and even longer for predators of that food to return.

San Francisco Bay Harbor Porpoises

Harbor porpoises as seen from the Golden Gate Bridge. (Photo: William Keener/Golden Gate Cetacean Research). From the QUEST Science blog

While it isn’t easy to collect data from such a large body of water, the same types of phenomena can be observed in local streams and rivers that many GLOBE schools are visiting to record data.  The Hydrology Chapter of the GLOBE Teacher’s Guide has quite a few protocols that students could use to examine the quality of the streams and its effect on life.

For instance, a change in water pH, which can be collected through the pH protocol, can affect the types of macroinvertibrates found in the water body.  This in turn has an effect on the food chain – whether that be through an increase or decrease in food supply.  This would be an interesting research study to do over the course of many years - following local legislation and news articles on water quality, monitoring the water as a GLOBE school, and seeing if there are any changes found.

To read more information about the return of the San Francisco Bay harbor porpoises, head on over to the QUEST science blog.  If you’re a GLOBE school and are participating in any of the hydrology protocols, we’d love to hear from you and your findings!  Leave a comment here or email us at science(at)globe.gov!

-jm

Posted in Backyard Science, General Science, GLOBE Protocols, Hydrology | 1 Comment

New report from the UK: Tree fruit ripening earlier. What does this mean and how does it tie to GLOBE?

A few weeks ago, the British Broadcasting Company (BBC) wrote about a report claiming that some of the fruit from native trees in Britain are ripening anywhere from 13 to 18 days earlier than they did a decade ago.  The report was from Nature’s Calendar, a data collection network in the United Kingdom.  While the cause isn’t specifically known, many believe it’s due to a change in climate.

What does a change like this mean to the earth as a system?

Scientists are interested in studying the connections between the different Earth processes – from how greenhouse gases are trapped in the atmosphere to biological processes occurring on land.  It is important to understand these intricate connections to attempt to paint a picture of what the climate will look like in the future . This includes the connection between weather and climate to biological processes, such as animal migration or a plant’s life cycle.  This is known as phenology, or the study of a living organism’s response to seasonal and climatic changes in the environment in which they live.  Seasonal changes include amount of precipitation, temperature, variation of the amount of sun light, and other life-controlling factors

As you may know, The GLOBE Program has a suite of phenology protocols to examine the response of native species to changes in season.  For GLOBE students and teachers familiar with phenology measurements, you may recognize this as the period between Green Up and Green Down, which are two of our protocols.  A consistent change in the length of time between Green Up and Green Down can indicate a change in climate.

While there were only two types of fruits examined in this study, rowan berries and acorns, all fruiting plants go through similar life cycles and can be related to Green Up and Green Down once the plant has reached maturity.  Once budburst and leaf growth has occurred for a given growing season, flowering will begin.  Flowering may not be easily recognized, because not all plants show with large, fragrant flowers.  For example, when the oak tree flowers, it looks something like this:


A picture of a flowering oak tree
Flowering oak tree, from mainenature.org

Then, either due to the wind or insects, the flowers are pollinated and begin forming fruit.  Keep in mind that just because it’s called a fruit doesn’t mean it’s actually a fruit for a human to eat, as some can be poisonous!  Once these fruits ripen, they fall off and begin to form a new plant through germination and maturation.

Fruit ripening occurs typically during a specific season due to the right combinations of conditions.  If one or more of these conditions were to change, then it can be assumed that the ripening time would shift in one direction or another.  In the case of the United Kingdom, there is a correlation between the ripening dates and April temperatures.  By having warmer surface temperatures in April, flowering is occurring sooner, and thus so is fruit ripening.  There is hesitation to say that it is directly tied to temperature, but may just be a result of more sun as well as longer and warmer summers.

The major concern with the changes of ripening dates is the effect it will have on various animals that rely on fruit ripening to lead migration or use for winter food.

How can GLOBE data help answer these types of questions?  First, it’s important to begin by taking air temperature, precipitation, and cloud measurements.  Each of these factors is important to the growing season.  Next, taking Green Up, Green Down, and Budburst measurements are also important, because it can give scientists an idea if there are shifts to the growing season as a whole.

With this particular study, only 10 years of data were used.   GLOBE, however, has been around for almost 17 years!  With such a rich history, it could provide additional information that could potentially be used to answer these questions.  And while this report was for the United Kingdom, it can easily be applied to any country or region in the world that has native, flowering plants!

If you’re a GLOBE teacher, have you used any of GLOBE’s phenology protocols?  We’d love to hear if you’ve seen any changes in your data collection over the years – please leave us a comment or email us!

-jm

Posted in Backyard Science, Climate Change, Earth as a System, GLOBE Protocols | Leave a comment

Thai flooding

2011 has been an interesting year in regards to rainfall for the GLOBE country of Thailand, as both the north and south portions of the country have seen significant flooding.  Let’s take a look at Bangkok, the capital city of Thailand, which is located in the north, as well as Phuket, which is located in the south.  Here’s a map of the country for those who aren’t familiar with Thailand, with the cities of interest indicated by the red dots:

Map of Thailand

Map of Thailand from Google

First, we’ll begin by examining the major flooding that occurred in the southern portion of the country in early 2011.

In Phuket, the following chart from weather-and-climate.com shows the distribution of precipitation through an average year:

Phuket, Thailand annual distribution of precipitation
Phuket, Thailand annual distribution of precipitation; image from weather-and-climate.com

Looking at the chart, there are clearly two seasons in relation to precipitation: a dry season that runs roughly from November through April, and a wet season that runs from May through October. What was interesting about the flooding in the southern portion of Thailand in 2011 was that it occurred in March, which is during the dry season.

Other than looking at precipitation, one way to determine the difference between the wet and dry season is to look at air and water temperatures relative to each other. The dry season is characterized by cooler temperatures over the land, and warmer temperatures over the ocean. GLOBE schools in this region could verify this by examining both the Max/Min/Current Air Temperature protocol as well as finding a data source that provides sea surface temperatures from ships or buoys. Because of these temperature differences, a gradient forms, and the winds will blow from the Northeast, bringing cooler air in from China.

In early 2011, an unusual cold wave hit the region, and temperatures were below average for a few days. This caused the normal temperature gradient seen in the dry season to be even more pronounced. While this doesn’t sound like something that would cause major flooding, more convection formed due to the different amounts of heating and caused this devastating flooding.

The flooding that is currently occurring in Thailand, however, is due to different causes, and yet is just, if not more, devastating than the flooding in Phuket.

In Bangkok, the following chart from weather-and-climate.com shows the distribution of precipitation through an average year:

Bangkok, Thailand annual distribution of precipitation

Bangkok, Thailand annual distribution of precipitation; image from weather-and-climate.com

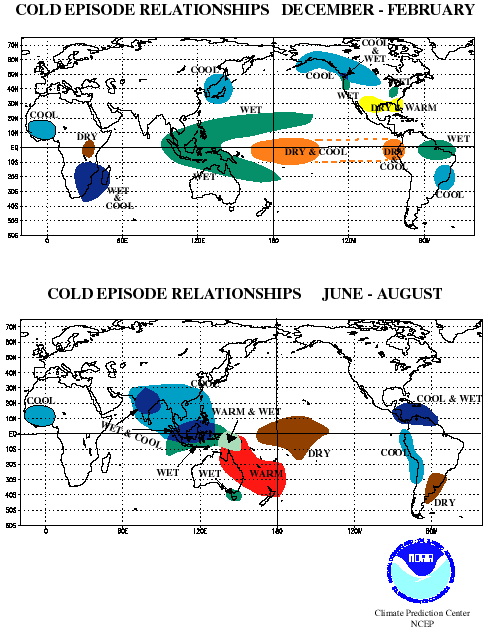
The current flooding in the northern portion of the country began in late July, which is during the monsoon season.  As we mentioned when we looked at the Near East-North Africa Region’s State of the Climate for 2010, the monsoon is a circulation pattern that carries moist air from the Indian and Pacific Oceans into Asia.  In addition to the monsoon, La Niña conditions increased the amount of rain that normally falls during the monsoon.  The following image may look familiar, as it was included in the Latin America-Caribbean State of the Climate post from a few weeks ago:

Global climate impacts during a La Nina event

You’ll notice that over Thailand, precipitation increases during a La Niña event.  For the months of August, September, and October, Bangkok recorded nearly 950 mm of rainfall, when the normal is only approximately 750 mm.  However, this anomalous precipitation was not the only cause of the flooding; large amounts of runoff from rain that fell even further north in Thailand reached Bangkok by October.

While the flooding is still occurring, it appears that the worst may be over, according to Bangkok officials.  For more details on the extent of the flooding, please read this article from the Vancouver Sun.

If you’re a GLOBE school in Thailand, have you experienced any of this flooding?  We would love to hear about your experience through a comment!

-jm

Posted in Backyard Science | Leave a comment

NOAA – State of the Climate: A look at Near East-North Africa

This week we’ll finish our look at the climate summaries for each GLOBE region with a focus on the Near East-North Africa region.  Remember that these annual reports provide a summary of the global climatic conditions and are a great benchmark for monitoring climate.

Regional reports provide a tremendous amount of information. The temperature and precipitation climate summaries are highlighted here, but if you are interested, more information about the Near East-North Africa region state of the climate is available from this website: http://www1.ncdc.noaa.gov/pub/data/cmb/bams-sotc/2010/bams-sotc-2010-chapter7-regional-climates-lo-rez.pdf

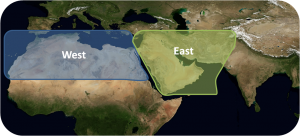
The Near East-North Africa region is different from most regions in that the region is mostly desert.   Even so, we’ll take a look at the Near East-North Africa region in two sectors: east and west.

A map of the GLOBE Near East-North Africa region

Temperature

The west sector includes the GLOBE countries of: Egypt, Mauritania, Morocco, and Tunisia.

For 2010, the west sector was exceptionally warm, observing temperature anomalies of +1 to +3 degrees Celsius.  Places like Morocco saw daily maximum temperatures exceeding 47 degrees Celsius!

The eastern sector includes the GLOBE countries of: Bahrain, Jordan, Kuwait, Lebanon, Oman, Pakistan, Qatar, Saudi Arabia, and the United Arab Emirates.

Temperatures in the east were also warmer than average across the entire sector.  The Saudi Arabian Peninsula, for example, experienced temperature anomalies ranging from 0.5 to 2 degrees Celsius above average.

Precipitation

In the west sector, 2010 was a very wet year.  In the summer, the Chefchaouen region of Morocco experienced devasting forest fires during the months of July and August, when temperatures were at their highest.  With the onset of fall and the subsequent winter, especially wet conditions led to flooding in localized areas of Morocco and Tunisia in October and November.

In the east, there were areas that received increased precipitation and others that had below average precipitation.  The Saudi Arabian peninsula was an area with below average precipitation in 2010; however, just to the east and north, Pakistan experienced the worst flooding in their history.  The flooding was due to an exceptionally strong Asian monsoon, which is a circulation pattern that carries moist air from the Indian and Pacific Oceans into Asia. The monsoon was stronger than usual due to La Niña conditions in the equatorial Pacific. Even though La Niña occurs thousands of miles away, it has a global influence on weather and climate.

To learn even more about the state of the climate in 2010 for the Near East-North Africa region, please find more detail in the actual report summary: http://www1.ncdc.noaa.gov/pub/data/cmb/bams-sotc/climate-assessment-2010-lo-rez.pdf.

Does your record of GLOBE data for the past year show any similarities to the summary provided here? Have you had any significant events have you in your local area? Please share them with us through the comment option below!

We hope you enjoyed our journey through the six GLOBE regions as we examined the state of the climate for 2010.  Each region is important to the overall balance of the earth system and is has interconnected climates. As GLOBE students working together to collect data and conduct research investigations in your area, you will help us better understand the climate system!

-jm

Posted in Climate, Climate Change, Earth System Science | Leave a comment