Taking GPS Readings — Part I

In GLOBE, you use careful measurements to learn things about our environment just as scientists do. Also, some of the data you take for GLOBE is used by scientists. Finally, what you learn from GLOBE about how to take measurements will help if you have the chance to volunteer to help in a local science study run by another organization.

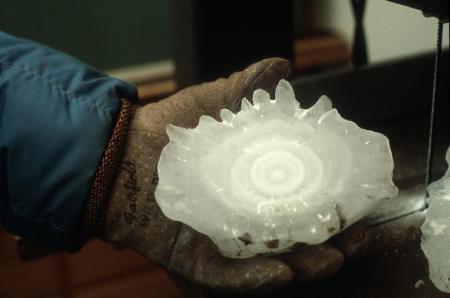
I recently had the chance to help survey a rock layer about 300 kilometers southeast of Boulder, Colorado. We were there to see whether a reddish-brown rock layer was level or tilted (sloped) in some direction. Since I study weather and climate rather than geology, I was there as a citizen scientist — a volunteer, rather than a professional. We took GPS readings of latitude, longitude, and elevation at the top of the reddish-brown layer. The top was fairly easy to see if the layers were visible, since the rock layer above it was white. You can easily see where the layers meet in the cliffs in Figure 1. We call where the layers meet the “contact.”

 The rock layers we were following
Figure 1. The rock layers we were following. The contact, or where the layers meet is at the top of the white walking stick (a ski pole) on the left side of the picture. The black line through the picture is where I taped two photographs together.However, most of the time the boundary (or “contact”) between the two layers wasn’t that easy to see. The rock layers were often buried under small pieces of rock. Then, we watched for areas where the small rocks had been washed away (Figure 2).

Reddish-brown rock layer exposed by a stream
Figure 2. The same reddish-brown rock layer exposed on the hillside by a stream.We took GPS measurements at the contact between the two layers for about a kilometer along the east side of a canyon on the first day of the field trip. On the second day, we took similar readings along the west side of the canyon. Each time we found the contact, we would lay the GPS unit on the ground there, record the latitude, longitude, and elevation, and then walk until we could see the contact again.

Figure 3 shows the results of our measurements. Combining the measurements for the two days, we found that the top of the reddish-brown layer sloped downward toward the north with about a 3% slope (if you go north 100 meters, the top of the rock layer will be three meters lower). Two other groups were following the rock layer a few kilometers away. Both groups found that the rock layer sloped toward the north, by about the same amount.

 GPS elevations along the sides of the canyon
Figure 3. GPS elevations along the east side of the canyon (23 September) and the west side (24 September). North is to the right of the graph, so the rock layer is lower to the north.

We were surprised that the GPS elevations worked so well:

  • First, the elevations varied rapidly on our GPS units.
  • Second, GPS experts tell me the elevation is less accurate than the location.
  • Third, we only took one reading at a location (though I would try to average the GPS elevation when it varied).
  • Finally, while our GPS elevations agreed well with the elevation of the rock layer from a topographic map on second day, the two elevations differed by slightly more than 20 meters the first day.

In the next few entries, I will describe why we were so successful.

Posted in Backyard Science, GLOBE Protocols, GPS | Leave a comment

Raindrops Part 3: More about Hail

Can you guess how hailstone size can be used to measure the strength of a storm? Here, “strength” refers to how fast the air moves upward in the storm: in other words, how strong the updraft is.

Hailstones grow until they are too heavy for the storm to hold them up. For hail to stay aloft, the air the hailstone falls through has to go upward at least as fast as the hailstone is falling downward relative to the air. As the hailstone gets bigger, its fall speed increases — so it will fall until it hits the ground — or finds air moving up fast enough to stop its fall or even carry it up again.

Careful Doppler radar studies of hailstorms and the appearance of hailstones show that the hail makes an interesting journey though the cloud before it falls. The hailstone in the picture has been sawed in half so that you can see what it looks like inside. Do you see the white and clear layers?

Hailstones start out small — as a single frozen raindrop or ice crystal; and, in one case, a fly! (Yes, I mean an actual insect!). Hail grows by getting coated with layers of ice (which “sticks” to the hail) or water (which freezes onto the hail) as it travels through the cloud. For example, raindrops freezing onto the hail form a clear layer, while ice crystals sticking to the hailstone form a white layer. So the hailstone provides a record of the type of precipitation it went through before falling to the ground.

Similarly, your shoes carry a record of where you were when you walk in the mud. As you clean off your shoes, the layers of mud will remind you of where you were. The light layer of mud came from near the school, and the darker layer of mud from near where you live. The mud on your shoes creates a record of where you walked just as the layers in a hailstone create a record of the conditions the hail has traveled through.

Scientist holding large hailstone
Giant hailstone that fell in Coffeyville, Kansas, showing alternating layers of clear and white ice. The fall speed of this hailstone was estimated to be 47 meters per second. Scientists don’t know what causes the “bumps” on the hailstone, but one hypothesis is that they grow like icicles from water flowing around the hailstone as it falls (remember — the hail is falling faster than the rain!). Picture courtesy of the National Center for Atmospheric Research.

Many books on weather show diagrams of hailstones making several up-and-down trips — perhaps riding the updraft up to where the ice is, then falling to where the rain is, and then getting caught up in an updraft (perhaps the same one), and then falling again. However, in parts of the cloud that are colder than freezing (remember, cumulonimbus clouds are very tall, so their higher parts have temperatures below freezing), there is liquid rain as well as ice and snow. Here, the hail can travel through alternating patches of ice and water without going up and down. Even at temperatures above freezing, the hailstone might travel through regions of melting ice particles as well as rain. Also, the outer layer of the hailstone could start to melt as it falls, and then refreeze as the hail is carried up to where it’s colder. It’s likely that hail travels in many odd ways before finally hitting the ground. Although scientists have some rough ideas of how hail forms and grows, there are many details to be filled in on exactly how.

Posted in Atmosphere, Backyard Science | 5 Comments

Falling raindrops — Part II

Someone asked, “How can you assume that the speed of the raindrop is 8 meters per second?” That number comes from some resesarch we did a few years ago on a squall line (line of cumulonimbus) in the tropics. We were looking at a squall line with Doppler radar. This particular radar “saw” raindrops rather than clouds or air. So our Doppler radar could be used to estimate the raindrop fall speed. In the storm we were interested in, the raindrops in the heavy rain were falling at 8 meters per second. (Horizontally, the raindrops follow the wind pretty well — something you know if you are trying to stay dry in a windy rainstorm. This means that scientists can use Doppler radars to study winds in a storm.) These measurements have been used to check the equations scientists use to predict their speed — basically balancing air resistance with the pull of gravity.

The speed of the drop (or droplet) varies with its size. Very small drops, like those in clouds, fall so slowly that the tiniest breath of upward-moving air can keep them aloft. If you fly through a cumulus cloud, it’s bumpy — the air is moving up and down. So some droplets go up, and some go down. If they are tiny, the sinking droplets simply evaporate. So the cloud stays up there in the sky.

Scientists have also measured raindrop fall speeds with upward-looking radars that can “see” both the drops and air. This way they find out how fast the drops move downward relative to the air. So we know that drizzle drops fall at about 2 meters pers second, and raindrops smaller than ours would fall in between 2 meters per second and 8 meters per second.

Why are the speeds different? Drops fall because they are pulled downward by gravity. The drop speed varies with size because of air resistance. Air resistance slows the drops down. If there were no air, drops starting from the same height would fall together at the same speed. This speed would increase with time due to the pull of gravity. With air, the drops quickly reach a speed at which the pull of gravity is balanced by air resistance.

You can see this effect with a simple experiment. Take a piece of paper, and squeeze it into a ball. Take a tiny pice of paper (less than 1 cm), squeeze it into a ball. Drop them at the same time. See how long it takes the two pieces to fall to the ground. The tiny piece should fall more slowly. If you make the tiny piece even smaller, it will fall even more slowly.

What about snowflakes? They fall very slowly, like downy feathers do when you drop them. Using the paper again, you will find that the paper squeezed into a ball will fall faster than a similar size piece that is not squeezed into a ball.

Scientist holding large hailstone
Scientist holding large hailstone. Photograph courtesy of the National Center for Atmospheric Research.

What about big hailstones? If you guessed that they would fall faster, you are right. Large hailstones can fall at speeds faster than 30 meters per second! How do scientists know? Again, they can track hail with radar. Or, they can make fake hailstones that have the same shape and density as real hailstones, drop them, and measure the time it takes the stones to fall a certain distance. When I started working at the National Center for Atmospheric Research, one of the scientists was dropping fake hailstones down a five-story stairwell and timing their fall. The hailstones were painted so that the surface looked like a chessboard or checkerboard, so the cameras could see how they tumbled as they fell. This was fun to watch! Through the window, that is.

These measurements can then be used to check and refine the equations that describe falling objects.

Posted in Atmosphere, Backyard Science | Leave a comment

Where did the rain come from?

I was watching a baseball game at Coors Field in Denver, Colorado, USA, when a big fat raindrop fell on my lap. I looked up — and there were only small altocumulus clouds overhead.

Where did the drop come from? Not from the altocumulus clouds — they were too thin, and the raindrops were big, even if there were only a few, so I guessed they came from a cumulus-type cloud. No one was pouring a drink from the upper seats: the drop wasn’t sticky.

In this case, the explanation is probably simple. The raindrop took a long time to fall from its parent cloud. By the time the raindrop fell to the ground (or rather my lap), its parent cloud had either changed, or more likely moved out of sight.

Cumulus and cumulonimbus cloud bases over Colorado are often higher than usual. This is because the air is very dry. Dry air has to rise a long distance before it can form cloud. Why? Clouds like the one that produced the raindrops form when air rises and cools. As air cools, the relative humidity rises. Once the air is “saturated,” that is the relative humidity is 100 percent, tiny water drops start to form. If the air near the surface is moist, the air doesn’t have to rise very far. For example, over the tropical oceans, the base of cumulus clouds in fair weather is about 600 meters above the water. And, if the relative humidity at the ground is 100%, you can get fog — the cloud base is zero meters above the ground.

So, on dry days, we see cloud bases that are even 3000 meters above the surface.

Scientists have measured the fall speed of raindrops in the laboratory and using radars looking straight up. Larger raindrops fall at higher speeds. I will assume my raindrop fell toward the ground at 8 meters per second.

If the cloud base was at 3000 meters, it would take 3000 meters divided by 8 meters per second, or 375 seconds, for my raindrop to fall from the cloud to my lap. That’s over six minutes. During that six minutes, the cloud probably moved out of my sight. Coors field is surrounded by three tiers of seats and high walls; so my view of the cloud could be easily blocked. For example, if the wind at cloud level was 20 meters per second, the cloud would have moved 7.5 km away by the time the raindrop hit the surface. If the wind at cloud level was 40 meters per second, the cloud would have moved 15 kilometers away. So, the cloud could have easily moved behind the “nosebleed seats” (the highest seats).

Illustration of explanation for rain with no cloud
Illustration showing possible explanation for the rain with no cloud. Coors Field bleachers blocking my view. Not drawn to scale.

I assumed the raindrop would fall straight down from the cloud’s original position over my head. This would happen only if the wind was calm below cloud level. However, I don’t think it’s a bad guess, since the average wind between the cloud base and the ground could have been close to zero.

Just for fun — watch how the rain falls from distant clouds — sometimes it falls straight down (when the wind is the same through the rain and cloud), and sometimes it falls behind the cloud (when the wind “steering” the cloud is faster than the wind below cloud base), and sometimes it spreads out when it reaches the ground (when the air is also spreading out).

Posted in Atmosphere, Backyard Science | 3 Comments

Watching the wind

GLOBE has protocols for measuring temperature, relative humidity, air pressure, and even aerosols. Did you ever wonder why there isn’t a protocol to measure wind? This picture can give you a hint. The flags in the picture are some of the flags that form a circle around the Washington Monument, in Washington D.C.

Flags on the lee side of the Washington Monument
Flags on the lee side of the Washington Monument, in Washington, D.C. The flags are wonderful indicators of the varying wind.

We are watching the flags downwind of the Monument. You notice how the flags are all different? This is because the wind, blocked by the Monument, forms eddies on the downwind side. So, even though the wind is over 45 kilometers per hour out of the northwest, the flag in the middle shows that the wind is blowing almost as strongly from the opposite direction! And the flag just to the right of the middle one shows that the wind affecting it is rather slow. Finally, the flags on the left and right side of the picture are being blown southeastward — that is, they show a northwest wind. I include a sketch — with some flags — on how the flags show which way the wind is blowing.

Arrows showing how the wind blows around the Washington Monument
Arrows showing how the wind blows around the Washington Monument. The little circles (poles) with squiggly lines (flags) show how the wind blows the flags. Only a few flags are shown. Imagine how the flags would be blowing in other places.

If we had a film of the flags, we would see them changing rapidly because the wind is changing rapidly. So the little arrows on the sketch are just at an instant in time. But, on average, the wind downwind (or on the lee side) of the Washington Monument would be slower than the wind on its upwind side. In a similar way, the house or apartment you live in or your school building blocks the wind. If the wind is out of the south, and you are on the south side of any of these buildings, the wind would be stronger than if you are on the north side. And, you would see lighter winds for a longer distance than you might think! Once, with a group of 4th-6th-grade students, I walked around their school building with a portable anemometer to measure the wind speed. Not only did the wind speed change a lot, but we could see that the trees and building were blocking the wind.

If you are interested in guessing the wind speed, a good way is to observe smoke, trees, blowing paper, or anything else the wind changes. For example, smoke going straight up means calm winds; and you can feel the wind on your face at 4-7 miles per hour (6-11 kilometers per hour). If you want to learn more about how to estimate wind speeds, find out about the Beaufort Scale for Land, at the web site: www.zetnet.co.uk/sigs/weather/Met_Codes/beaufort.htm. I used this scale when I took weather observations as a child.

So — keep your eyes open for flags, streamers, and wind socks — and watch the trees — to observe the wind in your area!

Posted in Atmosphere, Backyard Science | 5 Comments