Capturing Plant Green-Up Through Your Lens

This week we have a guest blogger, Jessica Taylor. Jessica has been active as a GLOBE observer and trainer since 2001 and is a Master Trainer at NASA Langley Research Center. She conducts regular GLOBE Teacher Workshops in the areas of atmosphere and phenology investigations and works with several NASA missions to integrate GLOBE activities into their educational outreach efforts.

Whenever I talk with teachers about studying phenology, their first question is always, “What is phenology?” To me, phenology is one of the most exciting observations we can make through GLOBE. The ability to observe, first hand, the life cycles of living things and how the processes change with seasons is an amazing connection to our environment. Sometimes it can be hard to visualize the potential impacts of climate change. This makes sense, because with climate we are talking about long time scales, so thinking about how our environment may be different in 30, 100 or even 1000 years from now can be difficult to understand. However, with plant phenology, you can start tracking real-life observations that may indicate how our environment is changing now.

The GLOBE Program provides some engaging protocols for phonological data collection. Scientists have been observing these changes in the environment for years using satellite images, measuring vegetation “greenness” using the Normalized Difference Vegetation Index (NDVI). Students can observe this greening of Earth through the seasons using various web-based tools at several websites.
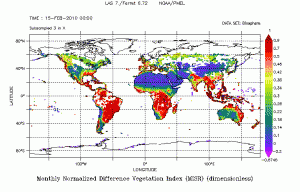
My NASA DATA allows students to access NDVI data and create their own color plots and time series graphs of NDVI
My NASA DATA allows students to access NDVI data and create their own color plots and time series graphs of NDVI

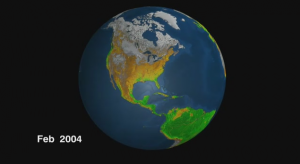
Screen shot of video showing satellite monitoring of plant life from space.

Satellite data can be used to monitor the health of plant life from space, and is visualized through this video (click the image to open a new window with the video) . The Normalized Difference Vegetation Index (NDVI) provides a simple numerical indicator of the health of vegetation which can be used to monitoring changes in vegetation over time. This animation shows the seasonal changes in vegetation by fading between average monthly NDVI data from 2004. The loop begins on September 24 and repeats six times during one full rotation of the globe at a rate of one frame per day. The fade for each month is complete on the 15th of each month.

The GLOBE Program also provides learning activities to facilitate the understanding of the science behind this investigation. One such learning activity is Green-up Cards. Creating your own class set of Green-Up Cards is a great way to start tracking local plant phenology.  As a trainer, I have incorporated this learning activity into my workshops, but have always wanted to showcase local plant species.  Teachers see the usefulness of this activity because it uses sequencing and pattern skills and helps illustrate the importance of detailed observations.  Teachers often ask if there is a database of photos they can use to help train their students in determining the vegetative phases of plant development.  By having GLOBE students around the world make their own Green-Up Cards, we can create a library of plant photos showcasing green-up across the globe.

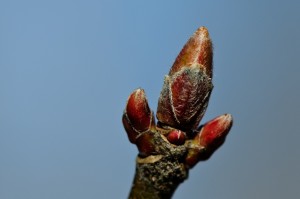
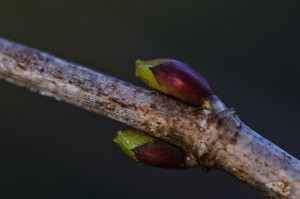
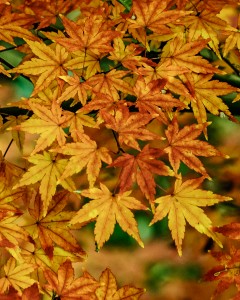
NASA Langley engineer David Beals has spent time looking at plant phenology and captured the following images.  These are great examples of what you can include in your Green-Up Card.

Leaves3

Red maple_Dormant_Barhamsville VA_Feb 26 2012-7321

Snowball Shrub_Budburst_March 10 2012-7519

Similar cards can be created for Green-Down, exhibiting the colors of plant senescence.  Documenting your plant phenology observations through photos and sketches is a great way for students to track plants’ life cycle and it creates a resource for future student observers.  This can be a part of your Student Climate Research Campaign  activities. You can extend this activity further by comparing your plant observations to local temperature and precipitation measurements.

Suggested activity: Start gathering your equipment and define a site for documenting Green-Up if you’re in the Northern Hemisphere.  You can learn additional information about this activity on the GLOBE website.  Once you begin taking photographs or drawings, share them with us on Facebook.  You could also use this activity as an inspiration for your entry into the GLOBE Earth Day Video Competition, which is occurring right now.

Posted in Earth as a System, General Science, GLOBE Protocols | 1 Comment

GLOBE and the Landsat launch

This week we have a guest blogger, Jennifer Bourgeault.  Jennifer, a member of the GLOBE Land Cover/Biology Team for 10 years, is the North Country Education Services (NCES) New Hampshire GLOBE Partnership coordinator and Master Trainer in the Land Cover/Biology protocols.  She thinks everyone should know how to use the Modified UNESCO Classification (MUC) Field Guide to classify land cover and how to use Multispec to look at change over time.

Unlike the Rover landing, no one from the National Aeronautics and Space Administration (NASA) Landsat Data Continuity Mission has appeared in the media write-ups with a Mohawk to encourage students around the world to think that science, technology, engineering and mathematics can be both cool and exciting.

Mars Science Laboratory (MSL) Systems Engineer Bobak Ferdowsi is seen reacting after the MSL rover Curiosity successfully landed on Mars, Sunday, Aug. 5, 2012 at the Jet Propulsion Laboratory in Pasadena, Calif. Photo Credit: (NASA/Bill Ingalls)

Mars Science Laboratory (MSL) Systems Engineer Bobak Ferdowsi is seen reacting after the MSL rover Curiosity successfully landed on Mars, Sunday, Aug. 5, 2012 at the Jet Propulsion Laboratory in Pasadena, Calif. Photo Credit: (NASA/Bill Ingalls)

Despite the relatively quiet coverage, on 11 February 2013 at approximately 18 UTC (1 pm EST), many scientists watched the launch with nervousness and anticipation, including me.  I had been counting down for days.  My colleagues and friends were both tired of my daily countdown and upset when I missed a day.  But many of them really didn’t know why I was so excited and what this launch means to GLOBE and to scientists who use remotely sensed data.

Fast fact: Once the satellite is fully tested, operational and in the hands of the United States Geological Survey (USGS), it will be known as Landsat 8.

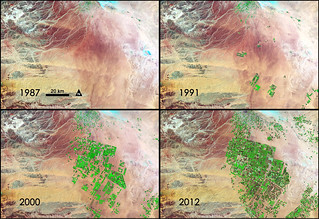
NASA Sees Fields of Green Spring up in Saudi Arabia.  Credit: NASA/GSFC/Landsat

NASA Sees Fields of Green Spring up in Saudi Arabia. Credit: NASA/GSFC/Landsat

For 40 years, we have been able to access data showing us how the Earth has changed over time.  We have been able to download these data for free for years.  By using MultiSpec (a free digital image processing software), there were no constraints on how young or old users were, what country they were from, by whom and for how much they were funded, or not funded, or even what they were using these data for in their research. Scientists, students, and citizens of every country in the world could process these data, create images, and study the Earth and its changes over time with a computer, a tutorial and basic remote sensing knowledge. These data are at spatial, spectral and temporal (passes over a location every 16 days) resolutions that can be used to consistently monitor ecosystems and forest types, natural disaster impacts from floods, volcanoes, and fires, and urban development.

Fast fact: For GLOBE land cover mapping, we typically use 5 spectral bands – 3 visible light and 2 near-infrared – with 30 meter spatial resolution.

What if this launch did not go well?  Landsat 5, with a projected lifespan of only three years, was recently decomissioned after 30 years of collecting data!

The decommissioned Landsat 5 gets a new title by setting a Guinness World Record as the “Longest Operating Earth Observation Satellite.”  Credit: USGS

The decommissioned Landsat 5 gets a new title by setting a Guinness World Record as the “Longest Operating Earth Observation Satellite.” Credit: USGS

Landsat 6 never achieved orbit. Landsat 7 collects data, but it has large gaps in coverage for each scene. Would our data record of the Earth stop? No. There are other satellites and other ways to collect data – but not for free, and not with the breadth of Landsat. Landsat is a lot like GLOBE: accessible to everyone, everywhere, with a legacy of data and an amazing mechanism to continue on its mission, with no boundaries. And the possibilities are endless when GLOBE research is carried out by students using Landsat data.

On Monday, Feb 11th, if you weren’t cheering on the launch or weren’t thinking about its significance for GLOBE, don’t worry; I was doing enough of that for all of us.

“Landsat is the one monitoring system that for the last 40 years has provided every citizen of planet Earth the scale and the resolution to observe – for himself or herself – the changes and the ability of this planet to provide for each and every one of us those services that we require.  I’m happy to say that thanks to that flawless launch today, the Landsat legacy will live on.” - Marcia McNutt, director of the USGS

Suggested activity:  Did you watch the launch of Landsat, or have you been using Landsat to do GLOBE?  Let us know about it either on Facebook or through the “Tell us about it” link on your profile page on the GLOBE website.  You can also read more about Landsat by looking at the fact sheet.  And finally, be sure to check out some of Jennifer’s favorite Landsat photos.

Posted in General Science | Leave a comment

How does GLOBE improve your community? Show us! 2013 Earth Day Video Competition

Earth Day has been inspiring demonstrations and projects for a healthier, more sustainable environment for more than 40 years.  The first Earth Day, celebrated on 22 April 1970, featured over 20 million Americans joining together in auditoriums, parks and streets across the country to show solidarity in the fight against oil spills and toxic dumping, protecting wildlife and their habitats, and carbon emissions.  Today, communities all over the world participate in events to raise environmental awareness.

The GLOBE Program, launched on Earth Day 1995, celebrated Earth Day 2012 by engaging GLOBE students in a video competition.  58 short videos were submitted by students from 19 countries showing themselves and their colleagues engaged in exploring their local climate through GLOBE protocols.  Each video featured students explaining, either in their native language or English, what they were doing and how that related to their climate research projects.

2012 Earth Day Video Competition Film Strip

The following images are screen captures from the winning videos from the 2012 competition.  Clicking on the image will take you to The GLOBE Program’s YouTube Channel where you will be able to watch the video in its entirety.  You will also find the second and third place videos from each region in the Student Climate Research Campaign Video Competition YouTube Channel.

2012 Winning Video from Africa Region

2012 Winning Video from Africa Region

2012 Winning Video from Asia and Pacific Region

2012 Winning Video from Asia and Pacific Region

2012 Winning Video from Europe and Eurasia Region

2012 Winning Video from Europe and Eurasia Region

2012 Winning Video from Latin America and Caribbean Region

2012 Winning Video from Latin America and Caribbean Region

2012 Winning Video from Near East and North Africa Region

2012 Winning Video from Near East and North Africa Region

2012 Winning Video from North America Region

2012 Winning Video from North America Region

The GLOBE Program is once again hosting a video competition for Earth Day 2013, This year, the theme is: “How has doing GLOBE improved our local community?”  Videos, which should be no more than two minutes in length, should be uploaded to your favorite video sharing website and sent to The GLOBE Program.  Winners will be announced starting on 16 April 2013, with the top overall video announced on Earth Day 2013.

For more information, such as judging criteria and video submission information, please see the Earth Day Video Competition page on the GLOBE website.  We look forward to receiving your videos and witnessing  how The GLOBE Program is impacting communities all over the world!

-Jessica Mackaro

Posted in Field Campaigns | 1 Comment

An interesting relationship: soil temperature and climate change

It seems common place that warmer air temperature leads to warmer soil temperature. And while this relationship seems intuitive, the effect isn’t always studied, especially with respect to the response from microorganisms. That is why researchers are investigating what happens when the soil temperature increases.

An intricate network of soil microorganisms From: Commonwealth Scientific and Industrial Research Organisation (CISRO).

An intricate network of soil microorganisms From: Commonwealth Scientific and Industrial Research Organisation (CISRO).

The study, performed by scientists from the University of New Hampshire, the University of California-Davis and the Marine Biological Laboratory, examined how microorganisms in the soil respond to temperature changes.  By learning more about that process, scientists could then improve the prediction of how much carbon dioxide is released from the soil.

Microorganisms in the soil release carbon dioxide as a byproduct of how they utilize their food source.  There are two types of food sources: glucose, a simple food source that is release from plant roots, and phenol, a complex food source that comes from decomposing organic matter such as wood and leaves.  Under normal conditions, they release at least 10 times the amount of carbon dioxide that human activities do in a year through the breakdown of these two food sources.  For a perspective on what this amount means, take a look at the graph below, taken from a study from 2010.

Time series of global carbon emissions from fossil fuels.  Image from EPA.

Time series of global carbon emissions from fossil fuels. Image from EPA.

This dramatic amount of carbon dioxide is usually absorbed through the root uptake of trees.  But if the soil warms too much, then these microorganisms are not as efficient at breaking down their food, and thus release more carbon dioxide as they expend the energy.  They are then over-producing, and the trees and plants will not take up as much.  In the short term, it may lead to a positive feedback cycle – where more carbon dioxide is emitted contributing to the rising amount of carbon dioxide in the atmosphere.

However, this same research showed that these microorganisms may have the once again become efficient with their food breakdown after many years of warmer soil temperatures.  After approximately 18 years, the community once again became efficient in their ability to break down food.  This may be due to one of the following things: a change in the community of microorganisms (i.e. the type of microorganism changes), a change in the available nutrients,  and/or species adaptation.

While GLOBE doesn’t have protocols to look directly at microorganisms in the soil, it does have protocols to examine soil temperature.  This is just as important, because soil temperature directly affects many things, such as the timing of Budburst, Green Up and Green Down.  The timing of the phenological processes is important because it informs farmers when to plant crops.   For these reasons, it is very valuable to collect soil temperature data and monitor its changes through the seasons and years.

Suggested activity: Have you collecting soil temperature data?  Did you participate in December’s Surface Temperature Field Campaign?  Have you seen any changes?  We’d love to hear about your experience!  Leave a comment, share with us on our Facebook page, or send us an email.  And make sure you enter the data you’re collecting into the GLOBE database!

-Jessica Mackaro


Posted in Carbon, Climate, Climate Change, Earth System Science, General Science, Soil | 2 Comments

Trees in trouble: what affect does tree mortality have on climate change

Through our trees in trouble series, we’ve examined trees in the Sahel zone in Africa and the United States.  This problem, climate change and dying trees, has been seen on every continent, the only exception being Antarctica, due to the lack of vegetation on the frozen continent.  Scientists have recently found that there is an alarming loss rate of big, old trees, whose ages range from 100-300+ years, in all latitudes.  And both coniferous and deciduous trees are at risk.

Delamere Forest in England – photo from Flickr, user: andrewoliver2011

Scientists are well aware of the potential implications that climate has on these trees, what they aren’t aware of is the affect that the reduction in forest will have on the world’s ecosystems.   Trees act like giant lungs, taking in carbon dioxide and releasing oxygen.  Studies have shown that trees take in more than 50% of human-generated carbon dioxide and store it.   Therefore, if these big trees continue to die, there’s more carbon dioxide left in the atmosphere, which can lead to additional atmospheric warming.  Furthermore, if the trees are dead, they cannot provide the key nutrients, such as nitrogen or seeding, to the surrounding soil to allow the forest to re-establish itself after fire or windstorm.

Forest die-off can also affect things like surface moisture and climate classification.  Heat and drought affect each tree species differently, which can result in a long-term shift in the dominant species found in a location.  For example, a forest may become grassland.  This will also affect soil moisture, as there will be no tree canopy to intercept rainfall or prevent the exposure to harsh sun and wind.

But it goes further than that.  Trees provide homes to many different types of animal life, from mammals to birds and reptiles.  As the trees die, these animals are forced to look for a new habitat.   It is feared that as trees die, so will different species that rely on these old trees.

The GLOBE Program has protocols that can aide in the examination of how these forests are changing. Looking at land cover classification while taking air temperature and precipitation measurements can start the foundation for an exploration between climate change and land cover change.  The month of January features a repeat of the Climate and Land Cover Intensive Observing Period (IOP).  With that IOP, teachers and students are encouraged to classify their land cover as well as take photographs.  By keeping these records over the years, GLOBE schools can contribute to studies following forest mortality.

Suggested activity: Participate in the January Climate and Land Cover IOP by establishing or visiting your land cover site.  Submit your photographs and land cover classification to the GLOBE website.

-Jessica Mackaro

Posted in Atmosphere, Climate, Climate Change, Earth System Science, Land Cover | Leave a comment