Understanding Why Climate Change is Human-Induced: A Day in the Life of the Earth

guest blog by Dr. Jeff Goldstein, Science Educator and Planetary Scientist and Director of the National Center for Earth and Space Science Education, reprinted from Dr. Jeff’s Blog on the Universe, posted 13 June 2009, with permission of the author

“Daddy, how long is a billion years?”

As soon as we got in the car this morning, and buckled up, I said “so Jordi, I need some help. I need more material for the blog.” “Daddy, what do you mean by ‘material’?”  “That’s what writers call the stuff they use to create stories”, said daddy.
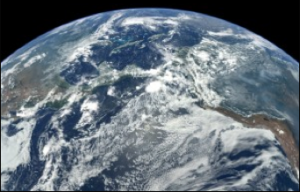
Earth from MESSENGER spacecraft as it flew by Earth on August 2, 2005. MESSENGER goes into orbit around Mercury on March 18, 2011.

It was a beautiful, sunny morning, so he started talking about … the Sun. He had lots of questions—where did it come from, what’s burning on it to make it so bright, how old is it, what will happen to Earth when it stops burning? The last one was particularly cool. I asked him if he thought the question “what will happen to the Earth when the Sun dies?” is something lots of kids might ask. He said “yes!!” I asked him who he thought was the first person to actually figure it out. He didn’t know. I told him it was me.

When I was a grad student at Penn, one of the undergrads in the class I was teaching asked that question. I didn’t know the answer, so I told her I’d find out. I tried but I couldn’t. Nobody had done it before. So I decided to be the first. I didn’t know if I could, and I didn’t know what I’d find, but it was incredibly exciting—and that’s science. Here’s the result. (And it was far from the end of the story.)

Jordi said, “YOU DID?” I looked at his surprised face in the rearview mirror and said “yup, your daddy.” Then he said, “that’s sooo strange! That’s sooo cool! I asked a question that YOU figured out!!” He was very proud. I felt so connected to him. (We’ll see later if he told his friends.) And I promise that I’ll make this story into a blog post, because now YOU’RE waiting for the rest of the story.

By the time we arrived at the school 20 minutes later, I had a month’s worth of ‘material’ for Driving with Jordi (stay tuned). The conversation was incredible. At one point though, Jordi ran into a conceptual wall when I was talking about the Sun’s lifetime being 10 billion years, and that it’s now half way through its life. He said “Daddy, how long is a billion years?”—which is why I wrote this post.

It is actually such an important question, and I thought about it all the way home. It’s at the heart of a key recurring problem in science education in that the VAST majority of humans truly don’t understand lengths of time that are far longer than our lifetimes. No wonder that folks don’t understand global warming as due to human intervention, and think it reasonable to interpret the data as explained by natural variation in the environment over long timescales. No wonder that folks don’t understand the timescales for evolution of species.

So here now is a novel way to look at it. Thanks Jordi! I think this will help lots of folks understand something they’ve never understood before.

Humans and Time

We humans now live on average about 75 years (in the developed world; in Africa the life expectancy is frighteningly low at 32 to 55). I’ll assume that 75 years is the life expectancy of a human in the absence of devastating diseases like AIDS, and with availability to modern medicine.

We humans also like to perceive the passage of time in units of seconds, minutes, hours, days, weeks, months, and years. We’ve created these units because they are comfortable, connected to the rhythms in the sky and in our bodies, and each is used to make sense of events both short and long. Here’s the critical point for the rest of the story—

One of our average humans sees 75 years x 365.25 days/year =27,394 days in their life

That’s amazing. That’s 27,394 days of getting up in the morning, eating, working, playing, relaxing, and going to bed. Put this way, the length of a single day is absolutely inconsequential relative to a human lifetime. Agreed? Good.

A Really Cool Diary

So let’s say I had this really cool diary with one page for every day of our average human’s life. It’s a single book with 27,394 pages. I could give it to you at birth and ask you to record your life one page—one day—at a time (with some help from a friend in your early and possibly later years). Like I said, one cool diary.

A Day in the Life of the Earth

Let’s say planet Earth was this large cosmic creature. She’s got a life expectancy of about 10 billion years, from her birth with the Sun nearly 5 billion years ago, to her ultimate fate when the Sun is in its waning years some 5 billion years from now (nope not telling).

Earth obviously has a lot to say, and SHE’s been keeping a diary since she was born. But she’s got it in far too many volumes, since each didn’t come with many pages, and they’re all old and worn out. Hey, I think a new diary is a perfect gift for her! I’ll give her one of my really cool diaries with 27,394 pages. I’ll help her move all her old diary entries into the new one so it will truly record her 10 billion year life. Why don’t we call each page a GEOLOGIC DAY (a Dr. Jeff made-up term.) And every Geologic Day is absolutely inconsequential relative to Earth’s lifetime. After all, Earth has 27,394 of them.

Every Geologic Day, Earth will write in her diary the comings and goings for that day. Here’s the next important point—

Every one of the 27,394 pages in Earth’s diary—each Geologic Day—is 365,000 years long.enough time for 14,600 human generations

How come? Easy: 10 billion years divided by 27,394.

Take a minute to process that.

I hope this gives you a new perspective for spans of time for Earth—called geologic time—relative to the time span for our fleeting lives.

So I give my friend the Earth one of my cool diaries. She likes it—her life all in one book. I also happen to be very close with Earth, and she’s letting me look at her diary. So here we are in the middle of her life and she just now finished her entry for day 13,697. She’s already written the first 13,696 pages (I helped her transfer the entries from her old diary with Apple Time Capsule.) Here now is her page 13,697—

Dear diary-

Today, as always, I’m going to keep a watchful eye across my surface. It’s an important responsibility being an oasis of life in a vast space. I’m very aware that all the countless forms of life living on me depend on a very delicate balance of surface conditions. Every Geologic Day, I hope I can avoid asteroids, comets, and super volcanoes, all examples of catastrophic events that have wreaked havoc with my sphere of life—my biosphere—in the past.

Today started out as pretty routine with lots of new things to see. I’m still watching those bipedal creatures that first appeared about 6 Geologic Days ago. Over the last few days, it looked like there were a few different species of them. But by late today I’m pretty sure there was only one dominant species left. I’m fascinated with them. They’re intelligent. They make tools.

Well, time to stop writing it’s just about the next Geologic Day. There’s only 35 Geologic Seconds left in this one (150 years to us humans). Wait … did you see that?! Carbon dioxide levels in my atmosphere just spiked! This just can’t be right! All of a sudden carbon dioxide is at the highest level it’s been in at least 2 Geologic Days (800,000 years) … maybe even 50 Geologic Days (20 million years)!

This is serious. Carbon dioxide might seem innocent enough—my diversity of life creates and uses it. But my neighbor Venus has an atmosphere that is 96% carbon dioxide, and while her surface should be about 125°F (50°C) at her distance from the Sun, the actual temperature is 880 °F (470 °C)—hot enough to melt lead. Carbon dioxide is a gas that induces a greenhouse effect on a planet, causing elevated surface temperatures, and in the case of Venus the effect is absolutely extreme. In my case, my biosphere is in a delicate balance, and even though carbon dioxide is a trace gas, a substantial percentage increase can cause dramatic changes in the environment.

IN AN ALMOST IMPERCEPTIBLY SMALL AMOUNT OF TIME—carbon dioxide in my atmosphere has skyrocketed by 60% over typical levels. Its increase is nothing short of—stunning. This is not due to natural cycles. No natural variation would happen this fast. This is the signature of a CATASTROPHIC EVENT. Some global scale, very short event that should be OBVIOUS. But I see no obvious crater, no super volcano … let me keep looking.

Wait. What’s happening now?! The temperature just spiked! Global temperature variation over the recent past shows “little ice ages” and warming trends, but what I’m seeing now is a SPIKE—a very quick change— that looks very different than those natural temperature variations. The global temperature is now CLEARLY INCREASING, and higher than it’s been recently (us humans currently have the ability to gauge it over the last 2,000 years), and it spiked at the same time as did the carbon dioxide.

This is very bad. Warnings are now coming in from everywhere—rapidly decreasing sea ice, rapid glacial melt. There has to be a cause. Something’s happened. Something’s different. This looks like the start of an irreversible change in the global environment. I’ve got to find out what’s happening before it’s too late for countless species on my surface. Let me keep looking and see if I can find something big that’s happened in this INSTANT in time … a trigger … something OBVIOUS.

Wait …. it’s … it’s the bipeds! OH NO … they’re everywhere! Their technology is EVERYWHERE—just in the last 35 Geologic Seconds! It’s an infestation!

They have got to be stopped. They’re supposed to be intelligent … maybe not. But I’ve got to try reasoning with them.

HEY YOU!! Look at the data!! Look at the data!! Quick! Quick!

What are you doing! Stop! Are you crazy?! Do you think you can load my atmosphere with those levels of emissions from your technology—in a blinding instant of time—and not impact me? Do you think my systems are capable of scrubbing the atmosphere that fast?  MY SYSTEMS DON’T WORK ON TIMESCALES OF 35 GEOLOGIC SECONDS!!

…not enough of them are listening

They’re too busy, too pre-occupied … with themselves.

They don’t seem to care if they are committing suicide. Their choice. But … they don’t have the right to take countless other life forms with them. I’ve got to put in an emergency call to Interplanetary Pest Control, or … tomorrow will be a very bad day.

(Note to reader: spread the word on climate change. I’d argue you have a duty to spread the word. You should Tweet this one up planet-wide. And be moved to leave a comment.)

To Teachers:

You can really make this a powerful visual demonstration in class. The life of Earth recorded on 27,394 sheets of paper is a challenge to demonstrate. But if you can borrow some cartons of xerox paper, with each carton containing typically 10 reams, then here is what I’d do. Each ream contains 500 sheets. So you need 5 full cartons (that’s 50 reams = 25,000 sheets) + 4 reams (another 2,000 sheets) + 394 sheets.

Without telling the class anything about what you are doing, have them take the reams out of the boxes (without opening them) and lay them out on the floor. Have them open one ream to see how many sheets are in it. In fact, have them count the sheets in the ream and take out the 394 sheets you need. Then:

• walk them through the concept of a single diary for an average human lifetime: they should calculate how many diary pages they would need if there is one page per day; then have them calculate how many sheets are on the floor—”oh, the number of days in a human lifetime!  WOW!!  That’s a lot of days for a human!”

• let them in on the idea of giving this diary to Earth, and assuming a lifetime of 10 billion years, have them calculate how many years of history are on EACH sheet—”365.000 years! No way!!” Then have them calculate the equivalent number of human generations on one sheet assuming 25 years per generation (a reasonable time from parent birth to child of parent birth)—”Can that be right? 14,600 generations!?”

• re-arrange the paper with half of it on one side of the floor to represent Earth’s history that is already recorded,and the other half on the other side of the floor representing Earth’s future history.

• then pick the single sheet of paper that represents the last 365,000 years of history, so that on this sheet, the final diary entry is the present. Lay it between the two groups of paper representing the past and future history of Earth.

Ask the class to think about this sheet of paper as a 24-hour clock. So at time 0:00:00, you’re at the beginning of the sheet, 365,000 years ago. At time 12:00:00 you’re in the middle of the sheet 182,500 years ago. At time 24:00:00 you’re in the present moment, where you all happen to be sitting in class.

Ask them to calculate the time on the clock when human civilization began (10,000 years ago, answer: at time 23:20:19); when the industrial age began (the age of fossil fuels; 150 years ago, answer: at time 23:59:25).

Have them look at world population growth noting what’s happened during the age of fossil fuels, the carbon dioxide level over the last 650,000 years, and the world temperature over the last 2,000 years. What is the data telling you?

• have them figure out how many sheets ago the dinosaur extinction took place.

• have them research Earth’s geological history, and figure out which sheets contain other milestones or important intervals in Earth’s history.

This should be MIND BLOWING! It is an experience your students will likely remember for a lifetime.

* * *

Image courtesy NASA, Johns Hopkins University Applied Physics Laboratory, and Carnegie Institution of Washington.

From Dr. James Hansen, Director of the NASA Goddard Institute for Space Studies, concerning this post—Public understanding of climate change depends on an understanding of time scales. Goldstein [Dr. Jeff] does a brilliant job of making clear the rapidity of the human-made intervention in the climate system, and the correlation of global warming with the appearance of technology powered by fossil fuels.

Image courtesy NASA, Johns Hopkins University Applied Physics Laboratory, and Carnegie Institution of Washington.

Posted in Carbon, Climate, Climate Change, Earth System Science, General Science, Scientists | 3 Comments

The Year 2064: A look at the Unmanned Aircraft Systems!

By Dr. Charles Kironji Gatebe, NASA Scientist for GLOBE Student Research Campaign on Climate

The year is 2064 and you’re telling students how Unmanned Aircraft Systems (UAS) first made debut flights to make measurements of atmospheric composition, way, way up in the atmosphere at 20 km from the ground and flying for over 30 hours non-stop. Today, this sounds like a Wright brothers’ story that your  teachers told you when you were young. The unmanned aircraft are now so commonplace that well-to-do families own at least one UAS for vacationing in the cosmos. The story sounds funny to the students hearing that NASA was just beginning to deploy UAS in field missions. NASA now have sophisticated UAS, which look like bats and have capability to fly anywhere anytime, and can be programmed on the fly to make any type of measurements needed by scientists.  Actually, NOAA now uses them routinely to monitor the global environment.

NASA Global Hawk (FS-098-DFRC)

The era of UAS in operational atmospheric research at NASA began in earnest in the year 2010. It was a very eventful year and remarkable in many ways. It was a year of El Niño (full name is El Niño-Southern Oscillation (ENSO)), which produced a lot of rain, floods, and other disturbances such as droughts in range of locations around the world. In the same year, earthquakes shattered records in Haiti where more than one hundred thousands lives were lost, while in Chile the 8.8 magnitude earthquake moved the entire city of Concepcion at least 10 feet to the west and shortened the length of the day by about one-millionth of a second. There was also so much talk about climate change, and the world political leaders could not agree on the steps needed to halt the rising CO2 levels that scientist had identified as the main cause of global warming.  So, NASA had just announced that in a period of six weeks between March and April, scientists would deploy an unmanned aircraft system named Global Hawk, for the first time to a field experiment named GloPac (Global Hawk Pacific Mission). The mission would take place out of Dryden Flight Research Center in California, USA, and would cover the entire offshore Pacific region with four to five 30-hour flights. The purpose of this experiment would be to support validation of a satellite known as Aura, which carried instruments for measuring gases such as ozone, carbon monoxide and nitrogen oxides. A ground based crew would guide the aircraft from the equator to the Arctic Circle, as remotely controlled scientific payloads on board collected data on key regions of the atmosphere important in climate change and ozone layer research. Researchers on the ground would be able to watch their data arrive in near real-time via satellite link, and could redirect the aircraft to certain phenomena or regions of interest along the flight track. The lead scientist would communicate with the world via Blogs and share almost near real time the excitement of the new adventure of deploying science instrument on UAS  for the first time in the history of NASA.

This first Earth science mission of the Global Hawk demonstrated the value of this unique and powerful resource to atmospheric science in the world. Those who witnessed the moment, can still remember the excitement.

Go, go, Global Hawk! Soar high!

Posted in Climate, Climate Change, Earth System Science, General Science | Leave a comment

Earth Detectives: How We Know What We Know

By Dr. Lin Chambers, NASA Scientist for GLOBE

In December 2009, I attended the Fall Meeting of the American Geophysical Union, a huge annual meeting of scientists that Dr. Gatebe wrote about earlier in this space.  I have been attending parts of this meeting most years since I began working in atmospheric science in the mid 1990s.  This year I attended the meeting for the entire week, because I had a pre-meeting event to attend on Sunday before the conference began, and my own presentation was scheduled on Friday.

Since I had to be there all week, I deliberately decided to approach the meeting a little differently this time.  I made a point of attending sessions outside of my own area of expertise.  AGU includes 27 separate discipline sections, ranging from Atmospheric Science through Volcanology, so there was a lot of room for being exposed to new areas.  There is also a Union section that covers timely topics from the perspective of multiple disciplines.

So I attended some sessions in Atmospheric Sciences, and Education and Human Resources, my usual haunts.  But I also visited several Union sessions, Paleoceanography and Paleoclimatology sessions – the study of oceans and climate in pre-historical times, Global Environmental Change sessions, and Public Affairs sessions.  In the process I was exposed to a huge amount of new vocabulary, including several words I still don’t understand; but which clearly had a precise meaning to the scientists in those sessions (see my prior blog on the vocabulary of science.  I also got a glimpse into the many deep studies that scientists are carrying out in interesting places around the globe:  ancient lakes in Europe and South America, ocean bottom sediments, caves, glaciers, etc.  I also learned about some of the cutting edge new ideas that are being explored to better monitor our Earth today.

The paleo sessions were the most eye-opening experience to me, since my only exposure before this was the same as most people:  reading short articles in the newspaper.  It is quite a different thing to hear about this first-hand from the scientists carrying out the work.  It is clear that most have a deep understanding of the kind of system they are studying; they know about related research in similar systems (for example, lakes on different continents), and they have developed an extensive framework within which to interpret the local measurements.  This framework identifies and assigns dates to major events that can be seen in many locations, and allows local work to gain meaning from a wider context while avoiding the trap of drawing broad conclusions about something that may be only a local event.  The old saying about “standing on the shoulders of giants” seems a propos here.  Knowledge in these fields has been built step by step over many years, based on the work of many scientists.

I also attended a special lecture, the Bjerknes lecture, named after a famous meteorologist from Norway who developed much of our early understanding of weather systems.  The lecturer this year was Dr. Richard Alley, a Geoscience professor from Pennsylvania State University and a well-known ice core researcher.  His talk drew thousands of scientists, and was also webcast.  The recording is still available if you want to get a glimpse (http://www.agu.org/meetings/fm09/lectures/lecture_videos/A23A.shtml).  Again it was fascinating to hear how knowledge has evolved over time, with new discoveries continuing to explain things that were previously puzzles, gradually building a solid framework of understanding.

One challenge that I carried away from my small sampling of the thousands of talks presented at this meeting was the problem of how to integrate all this deep knowledge.  If one person could have all of this information together … I think they would need extra brains to hold it together!  But in this information age, finding a way to integrate all this knowledge to inform decisions about resource use and the future state of our planet is becoming more and more important.  I suspect – I hope! – that one day some of you may be involved in developing solutions to that challenge.

Posted in Climate Change, General Science, Scientists | Leave a comment

How Climate Models are Tested

by Dr. Peggy LeMone, NCAR Scientist, former GLOBE Chief Scientist and President-Elect of the American Meteorological Society

Have you ever wondered how people test climate models?   We used to have a joke that climate modelers had the best job security – because no one would know if their models were right or not until after they died.

Actually, climate models are being tested all the time.  How is this done?  A variety of ways. Here, I’m going to discuss how climate models are tested, based on some things I learned recently at a symposium on Paleoclimates, sponsored by the Western Interior Paleontological Society (WIPS).  The figures are from one of the keynote addresses, by Dr. Caspar Ammann of NCAR.

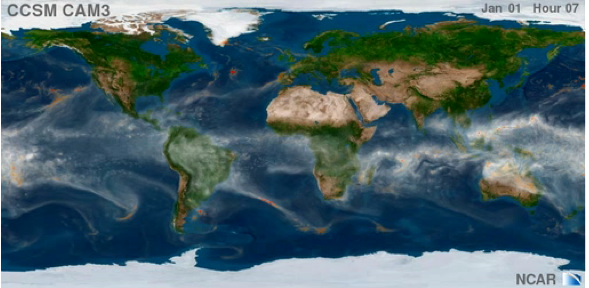
First, climate models are tested by seeing if they can replicate the current climate.  Figure 1 shows one such simulation.  The image looks a lot like a satellite view of the weather on Earth – with the long strings of white looking like warm and cold fronts.  Also, notice the concentration of water vapor near the Equator. This is the Inter Tropical Convergence Zone (ITCZ), where air comes together from the northern and southern hemispheres, and then rises.   This is a “gut test” – the model results look right.  If you follow this simulation through the year (and we did at the NCAR Visualization Lab), you can see the progress of the Indian monsoon, and the formation of a couple of tropical cyclones (though you need pretty high horizontal resolution for that).  I should note that the simulation is for a “typical” year in today’s climate. That is – you won’t find a January 1 that looks exactly like this.

Figure 1. Total water vapor in a vertical column in the atmosphere. Areas with more water vapor look white, intense concentrations are orange. Courtesy James Hack, NCAR. (download at: http://www.vets.ucar.edu/vg/T341/index.shtml)

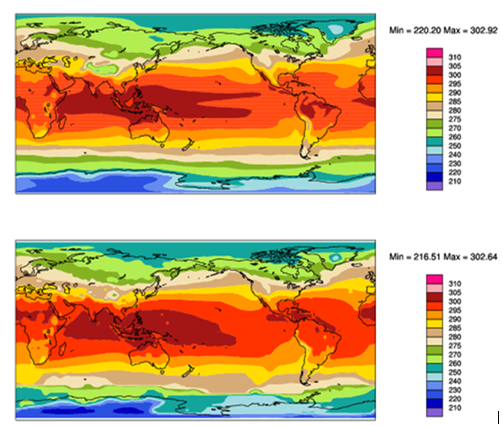
Climate models are designed to give us statistics about the weather, rather than specific real world weather events. For example, the climate model should be expected to do a reasonable job of reproducing the mean surface temperature over a season or over a year.  Such a comparison is illustrated in Figure 2.  The general temperature patterns are remarkably similar.

Figure 2. Surface air temperature. Top, from the Coupled Climate System Model, Version 3. Bottom, from observations. The relationship of colors to temperature is shown by the color bars to the right. Courtesy Caspar Ammann, NCAR.

Climate scientists also test parts of their models.  To understand this, let’s describe a climate model.  Like a weather model, the climate model solves equations for temperature, wind, water vapor, etc., on a three-dimensional grid of points.  For example, take a grid point 3,000 m above Dakar, Senegal.  Suppose the wind is out of the south, and the air is warmer to the south.  The model would “predict” that the wind would carry in warmer air, to warm the temperature by a specific amount.  Solar radiation, and longwave radiation (heat) from the ground and surrounding air layers would affect the temperature at this point, too.  Adding all these effects at each point will give a new temperature.  The same thing is done for wind, humidity, and whatever other variables the model is trying to predict.

Now imagine lots of these points – all over the Earth, and at heights from just above the surface to far up in the atmosphere.  Obviously, we need a computer to make all these predictions.  These predictions are made for specified time intervals, which vary with the grid spacing (and type of model).  The first set of values on the grid leads to a second prediction.  The second set of values on the grid leads to a third prediction, and so on.  For weather forecast models, the calculations are repeated for a few calendar days.  For climate prediction, the predictions can run for a thousand years.  (Of course the computer run will take a much shorter time than 1,000 years – otherwise the forecast wouldn’t be very useful!  To avoid confusion, scientists sometimes refer to “model time” (1,000 years) to contrast that with how long it took to run the model (much less)

We’d like these points to be as close together as possible, but the number of points is limited by the size and speed of computers, so the points are farther apart for climate models than for weather models.

Because of this, the effects of things like thunderstorms have to be estimated using what we call “parameterization schemes.”  If a thunderstorm went through our point 3,000 m over Dakar, the model would allow for that by changing the temperature (and wind, and humidity, etc.).

Climate models have also to account for changes in the ocean, and changes in the land surface, including ice and vegetation and soil.  The model will account for wet soil warming up the air more slowly than dry soil (but at the same time evaporation would transfer moisture from the soil into the atmosphere where it can later condense and release that stored heat), and solar radiation reflecting off an icy or snowy surface.   The amount of detail on the surface can vary from model run to model run.

And this leads to another way the models are tested – each of these parameterization schemes is tested.  Sometimes, observations are used.  These can be data routinely gathered using satellites, or data gathered in a field campaign focused on a specific phenomenon – like thunderstorms, or like stratus clouds to the west of continents.

Anytime observations are used, the model is tested for the “current” climate state, or its variability. But how can we be sure that the same model also might do a reasonable job for future climates when we expect things to be different?

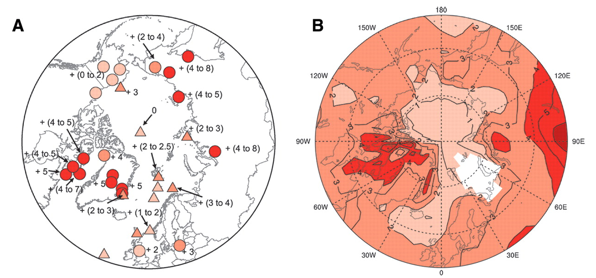
For this, one option climate scientists have is to simulate past climates. Because we have some information about past climates, we can see how well models reproduce them.  We all learn that our climate has changed over the age of the Earth.  For example, North America and Europe have had repeated glaciations during the last couple million years.  Figure 3 shows an example of one such simulation, with temperatures compared to the climate simulation.

Figure 3. Comparison of a climate simulation to temperature estimates, for the last interglacial, about 130,000 years ago. On the left side are real world proxy-based reconstructions of maximum summer temperature (circles are land records, triangles are marine records), on the right side is a model simulation that was done applying information about the Earths orbital configuration of that time. (Adapted from Figure 2, from Otto-Bliesner, B.L., S.J. Marshall, J.T. Overpeck, G.H. Miller A. Hu, and CAPE Last Interglacial Project Members, 2006: Simulating Arctic climate warmth and icefield retreat in the last Intergaciation Science, New Series, v. 311, No 5768, ;1751-1753.)

How do we know how the temperatures changed during geologic time?  We use other evidence (referred to as “proxies.”)    Much of the dicussion at thew WIPS symposium was about this topic. Here are just a few ways:

1.     Measuring the ratio of “heavy oxygen” (Oxygen-18, or oxygen with an atomic weight of 18) to light oxygen (the “normal” oxygen isotope, with an atomic weight of 16).  Since “lighter” water molecules evaporate more readily at cooler temperatures, more of it rises into the atmosphere to form precipitation, which is stored in the ice sheets during ice ages.  Thus more “light” oxygen in ice means cooler temperatures.
2.    Counting the teeth on the boundary of leaves.  The number of teeth is related to temperature.
3.    Determining from fossil leaves and pollen what type of vegetation lived in a given area.  If these are for the same (or similar species) that live today, this provides information about the climate under which the plant grew.
4.    From the temperature range of the nearest living relative of fossil animals.
5.    Looking at the fraction of Oxygen-18 in foraminifera, tiny (usually less than 1 mm across) little animals with shells that lived primarily in the oceans.
6.    Looking at the type of insect damage in plants provides clues about how tropical the climate was.
7.    Structure of a specific type of molecule (tetraethers) is a strong function of temperature at the time of its formation.
8.    And many, many more…

Similarly, fossil evidence provides clues about how rainy it was.  For example, the minerals deposited in channels formed by roots vary with how well-drained the soils were, and hence how dry the soil was.  And fossils of lush, tropical plants are associated with rainy climates.

Simulations of these ancient climates aren’t always consistent with the data – but scientists are finding that comparisons with paleoclimates can lead to both improvements in climate models – and sometimes, a refinement in the observations!

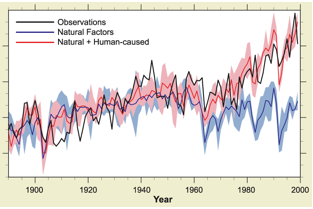
Given that, I’m going to show you my favorite simulation, which puts modern day influences on climate in perspective.

Figure 4. Simulation of climate for the last century. Blue includes experiments where only natural forcing factors were affecting climate: volcanoes and solar output. The red/pink simulations also include the effects of changes in greenhouse gases and dust produced by humans. The black line is the observed temperature record. (dapted from Figure 2, of Meehl, G.A., W.M. Washington, C.M. Ammann, J.M. Arblaster, T.M.L. Wigley, and C. Tebaldi, 2004: Combinations of Natural and Anthropologic Forcings in Twentieth-Century Climate. J. Climate, 17, 3721–3727.)

From Figure 4, one obtains the current warming record only if the effects of greenhouse gases are included.

Climate scientists continue to test their models – and improve them.  This is being done through improving the parameterizations, and, with time, running at higher resolution (smaller grid sizes).  With these improvements, climate scientists should be able not only to improve projected global average statistics, but they should be able to look at future climates in different parts of the world. The Holy Grail (ultimate goal) of climate modeling then is if model can do both global trends and regional impacts in both mean but also in variability, including the information about changes in extreme events!

Posted in Climate, Climate Change, General Science | Leave a comment

Velero de la Oportunidad

Lin Chambers

traducción al español: Camelia Deller

Se dan casos en los que al mismo tiempo que los científicos planean a menudo con cuidado campañas en zonas del mundo en las que están interesados, se encuentran con la oportunidad de hacer mediciones donde alguien ya va a ir. Por ejemplo, algunos cargueros y aviones de pasajeros transportan instrumentos para medir aspectos del océano o de la atmósfera, allí donde quiera que les lleve la ruta que sigan. Recientemente, se me presentó una oportunidad como la que les acabo de describir. Mientras el tiempo y las condiciones del barco lo permitan, la tripulación del velero Ocean Watch de casi 20 m. de eslora está realizando observaciones de nubes para el Proyecto S’COOL (Students’ Cloud Observations On?Line.
http://scool.larc.nasa.gov, un pequeño proyecto hermanado a GLOBE el cual dirijo), mientras la nave navega alrededor de las Américas.

Una aventura común entre el Pacific Science Center y el Sailors for the Sea, ATA. (http://aroundtheamericas.org) que incluye la participación del Ocean Watch, realizando la circunnavegación de los continentes Americanos del Norte y del Sur. La nave zarpó de Seattle, Washington, en el noroeste de los E.E.U.U. el 31 de mayo del 2009 y le llevará unos 13 meses completar la travesía. Ésta navegó ya las aguas del famoso Paso del Noroeste durante el verano, siguiendo al sur por la Costa Este.  Ahora se encuentra en la costa norte de Brasil, camino del punto más al sur de América del Sur, el Cabo de Hornos. La ruta, hasta el día de hoy y como fue planeada, incluyendo puertos en varios países GLOBE, la pueden encontrar aquí:
http://aroundtheamericas.org/story/ports?max=100.

Mientras que el objetivo principal del viaje es sensibilizar a la población sobre el tema de los océanos, el velero lleva consigo varios instrumentos para tomar
mediciones a medida que realiza su ruta. De la página web de ATA: “Diez científicos de seis instituciones (University of Washington’s Applied Physics Laboratory, el Joint Institute for the Study of the Atmosphere and Ocean, RMR Co., MIT Sea Grant, NASA, y Western Washington University) han equipado al Ocean Watch con una serie de instrumentos para recopilar un conjunto de datos de oportunidad durante el viaje. Los proyectos comprenden desde la ciencia polar y el tiempo atmosférico hasta el estudio de las poblaciones de medusas y la reflexión de la energía solar.

S’COOL está unido a NASA a través de un instrumento de satélite llamado CERES (siglas en inglés del Sistema de Energía Radiante de la Tierra y Nubes:
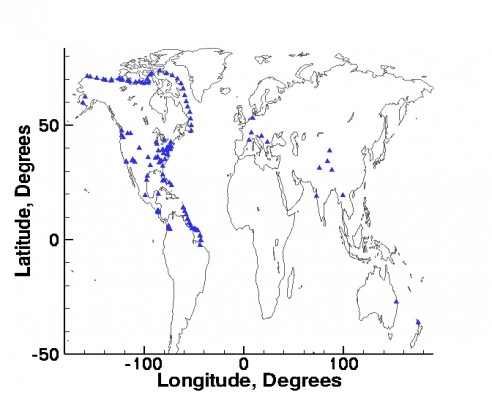
http://science.larc.nasa.gov/ceres/). Los horarios de observación se coordinan con el sobrevuelo de los satélites Aqua (http://aqua.nasa.gov) y Terra (http://terra.nasa.gov) que llevan a bordo los instrumentos CERES. Lo más crucial para la tripulación del Ocean Watch es coordinar las observaciones de nubes con el sobrevuelo de los satélites, teniendo en cuenta que ambos, el velero y el satélite, están moviéndose. La Figura 1 muestra un mapa de observación de sitios desde donde se han realizado Observaciones Errantes de Nubes (Rover), que permite obtener horarios de sobrevuelo del satélite desde cualquier sitio del globo, y a través del cual el Ocean Watch reporta. (Otros sitios del mundo que contribuyen con las observaciones Errantes también se hallan señaladas en el mapa)

Pregunta a considerar: ¿Por qué se hallan los puntos del mapa más separados en el Paso del Noroeste y más juntos a lo largo de la costa de América del Sur?
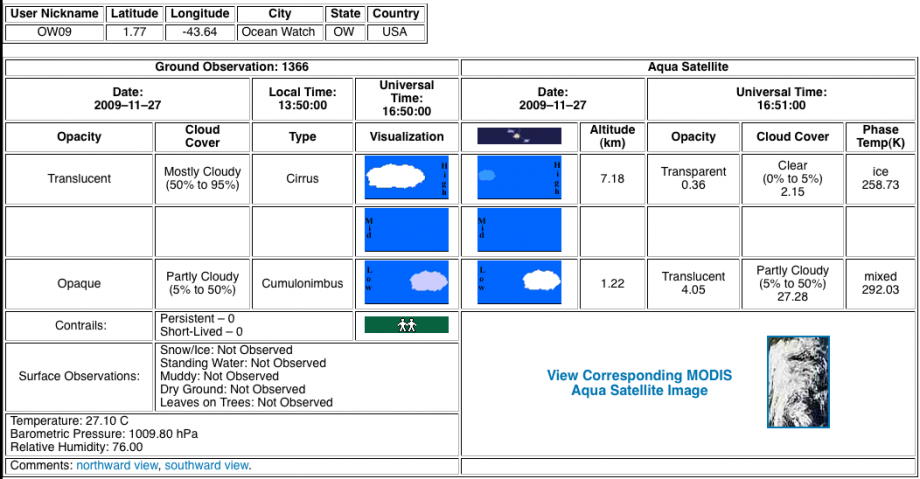
Los reportes de observación del Ocean Watch están a su disposición a través de Internet en http://scool.larc.nasa.gov/en_view_rover.html. Una vez coordinadas las observaciones con el sobrevuelo del satélite, los datos del satélite correspondientes a esa hora y sitio son también resumidos para ser comparados (ver ejemplo Figura 2). Para el tramo del hemisferio sur, hemos ingeniado una manera de enlazar fotos digitales tomadas por la tripulación a la hora de realizar una observación. Esto añade otra nueva dimensión a la comparación. Nuestro plan es llevar a cabo un análisis concreto de todo el conjunto de datos del Ocean Watch y como se comparan a la información proveniente del satélite una vez acabado el viaje. Pero pueden explorarlo ahora.

A los participantes de GLOBE cerca de la costa les podría interesar la información de los puertos donde amarrará próximamente la nave y visitar la misma y a su tripulación para así poder obtener más información de interés. No se olvide de comprobar el horario, ya que circunstancias varias y el tiempo alteran el curso de la nave.

Posted in General Science @es | Leave a comment