NOAA – State of the Climate: A look at North America

This week we’ll continue our look at the climate summaries for each GLOBE region, with a focus on the North America region.  These annual reports provide a summary of the global climatic conditions and are a great benchmark for monitoring climate.

Regional reports provide a tremendous amount of information. The temperature and precipitation climate summaries are highlighted here, but if you are interested, more information about the North America Region state of the climate is available from this website: http://www1.ncdc.noaa.gov/pub/data/cmb/bams-sotc/2010/bams-sotc-2010-chapter7-regional-climates-lo-rez.pdf

The GLOBE North America region, while only comprised of two countries, includes widely different geographic features.  Both countries feature beaches on both coasts, and mountain ranges.  The extreme southern tip of the United States has an equatorial climate, while the extreme northern portion of Canada has a polar climate.  Let’s examine the state of the climate for both countries for 2010.

Temperature

In Canada, 2010 was the warmest year since nation-wide records began in 1948.  Temperatures were about 3.1 degrees Celsius above the 1961-1990 average.

The United States did not observe departures from normal as extreme as Canada, and 2010 ranked as the 23rd warmest year since nation-wide records began in 1895.  While most of the country observed near- or above-normal temperatures, the Southeastern United States, which includes Florida, Georgia, Alabama, and Mississippi, observed temperatures that were below or much below normal.

Precipitation

2010 recorded an above average year for precipitation in Canada.  There were quite a few events that contributed to this.  In September, Hurricane Igor made landfall in Newfoundland, Canada, an area that does not experience many hurricanes.  The hurricane caused flooding and isolated many communities.  Further west, the Canadian Prairies observed a shift in precipitation patterns.  The early part of the year brought drought concerns, yet by April, enough rain had fallen to change those concerns of drought to concerns of flooding.

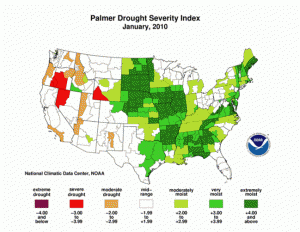
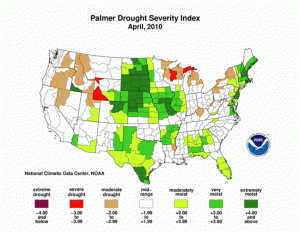
The United States also saw above average precipitation, with 2010 ranking as the 35th wettest year since nation-wide records began in 1895.  This was especially true in the western half of the country.  The months of January through March was the 15th wettest, mostly due to El Niño.  The following two images from NOAA show the Palmer Drought Severity Index (PDSI) for January of 2010 and again in April 2010.  The PDSI is an index that uses both temperature and precipitation information in a formula to calculate dryness. Here you will see the relief due to the rains in the western half of the country.

January 2010 United States PDSIApril 2010 United States PDSI

Like Canada, there were concerns of drought, mostly located in the western Great Lakes, south through the Ohio River Valley and eastward to the Mid-Atlantic states.  However, by November, enough precipitation had fallen to relieve some of the drought concerns, especially in the Ohio River Valley.

If you’re interested in learning more about the State of the Climate for the GLOBE North America region, there is much more detail in the actual report summary: http://www1.ncdc.noaa.gov/pub/data/cmb/bams-sotc/climate-assessment-2010-lo-rez.pdf.

If you are a GLOBE school in the United States or Canada, how did your weather and climate compare to this summary?  Do you have examples of extreme or notable events to share with us?  Do you have GLOBE data for your sites that support this summary?  Let us know!

Next week, we’ll finish our journey through the GLOBE regions with a look at our sixth region: Near East-North Africa.

-jm

Posted in Climate, Climate Change, Earth System Science, General Science | Leave a comment

NOAA – State of the Climate: A look at Latin America-Caribbean

This week we’ll continue our look at the climate summaries for each GLOBE region, with a focus on the Latin America-Caribbean region.  Remember that these annual reports provide a summary of the global climatic conditions and are a great benchmark for monitoring climate. You can use this data in your own GLOBE climate research projects!

Regional reports provide a tremendous amount of information including temperature, precipitation, tropical cyclone activity, and notable events. Temperature and precipitation climate summaries are highlighted here; more information about the Latin America-Caribbean Region state of the climate is available from this website: http://www1.ncdc.noaa.gov/pub/data/cmb/bams-sotc/2010/bams-sotc-2010-chapter7-regional-climates-lo-rez.pdf

The Latin America-Caribbean region has many similarities to both the Asia-Pacific region  and the Europe-Eurasia region . There are island countries, such as the Bahamas, countries that are landlocked, such as Paraguay, and countries that are highly mountainous, such as Chile, which is similar to the Asia-Pacific region. But Latin America-Caribbean is similar to Europe-Eurasia in that some of these countries are considered to reside in the mid-latitudes, which experience a wide variety of weather.

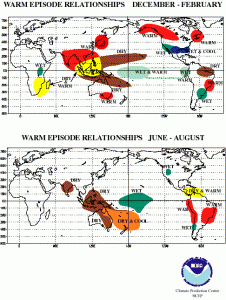
An important factor to make note of is that the beginning of 2010 was the end of El Niño phase in the equatorial Pacific and the development of La Niña in mid-2010. Each have a different impact on weather and climate in this region which can make a summary of the climate rather complicated. During El Niño (“warm episode”) the impacts in December-February and June-August are shown in the figure below from the NOAA Climate Prediction Center.

Global climate impacts during El Niño

Global climate impacts during El Niño


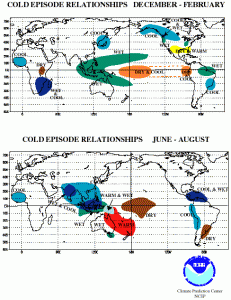
During La Niña (“cold episode”) the impacts are quite different.

Global climate impacts during La Niña

Global climate impacts during La Niña

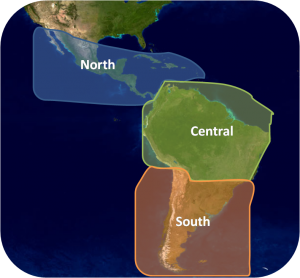
Latin America-Caribbean is an interesting region to examine, because it spans two hemispheres! So while one hemisphere is experiencing summer, the other is experiencing winter. We’ll take a look at the Latin America-Caribbean region in three regions: north, central, and south.

Sectors used in climate analysis for Latin America - Caribbean Region

Sectors used in climate analysis for Latin America - Caribbean Region

Temperature

The north sector includes the GLOBE countries of: Bahamas, Costa Rica, Dominican Republic, El Salvador, Guatemala, Honduras, Mexico, and Panama.

In the northern most part of the sector, Mexico and the Caribbean side of Central America recorded slightly warmer than normal temperatures. On the Pacific side of Central America, however, temperatures were below average, possibly associated with La Niña.

The central sector includes the GLOBE countries of: Bolivia, Colombia, Ecuador, Peru, Suriname, and Trinidad and Tobago.

In Colombia and Ecuador especially, temperatures were about +1.0 to +1.5 degrees Celsius above the 1971-2000 average. The other countries in this sector did not experience such strong signals. Suriname was the opposite of Columbia and Ecuador, where temperatures that were about -1.0 to -1.5 degrees Celsius below average were observed.

The south sector includes the GLOBE countries of: Argentina, Chile, Paraguay, and Uruguay.

This sector saw slightly below average temperatures for 2010. Paraguay experienced unusually low temperatures and snowfall from May through August. Some overnight temperatures were as much as 10 degrees Celsius below the average, causing many regions to declare states of emergencies!

Precipitation

In the north sector, 2010 was the second wettest year in Mexico since 1941. Record high precipitation was recorded for the months of February and July. These heavy rains caused mudslides, yet also filled dams that had been depleted due to many years of drought. Tropical cyclone activity and heavy rain associated with them contributed to the large rainfall in Mexico. In 2010, there were 13 named storms in the Caribbean, with seven hurricanes and three major hurricanes. This does not include the tropical depressions, which are not named but can still bring large amounts of rain.

In the central sector, the influence of El Niño and La Niña was apparent. While temperatures in Colombia and Ecuador were above average, so was their precipitation. The other countries observed below average rainfall, with values of 20-40% below average. In January, strong hail and precipitation caused flooding along the Vilnacota River, interrupting railway service and forcing evacuations.

In the south sector, recall temperatures were only slightly below average however, precipitation was significantly below average. Rainfall deficits were about 20-80% of normal. Even with the deficits, the sector experienced extreme precipitation events, which included flooding and snowfall that lead to destruction of bridges and other man-made structures.

Does your record of GLOBE data for the past year show any similarities to the summary provided here? Have you had any significant events have you in your local area? Please share them with us through the comment option below!

Join us next week as we continue on this journey through the GLOBE regions with a look at our fifth region: North America.

-jm


The Latin America-Caribbean region has many similarities to both the Asia-Pacific region [DJC1] and the Europe-Eurasia region[DJC2] . There are island countries, such as the Bahamas, countries that are landlocked, such as Paraguay, and countries that are highly mountainous, such as Chile, which is similar to the Asia-Pacific region. But Latin America-Caribbean is similar to Europe-Eurasia in that some of these countries are considered to reside in the mid-latitudes, which experience a wide variety of weather. 


[DJC1]Link to blog on Asia Pacific


[DJC2]Link to blog on Europe Eurasia

Posted in Climate, Climate Change, Earth System Science, General Science | Leave a comment

NOAA – State of the Climate: A look at Europe-Eurasia

This week we’ll continue our look at the climate summaries for each GLOBE region, with a focus on the Europe-Eurasia region.  Recall that these annual reports provide a summary of the global climatic conditions and are a great benchmark for monitoring climate.

Regional reports provide a tremendous amount of information. The temperature and precipitation climate summaries are highlighted here, but if you are interested, more information about the Europe-Eurasia Region state of the climate is available from this website: http://www1.ncdc.noaa.gov/pub/data/cmb/bams-sotc/2010/bams-sotc-2010-chapter7-regional-climates-lo-rez.pdf

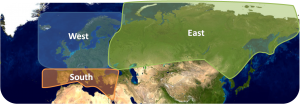
The GLOBE Europe-Eurasia region is interesting to examine, because not only is it such a large region, but portions are embedded within the Middle East and Asia regions defined by NOAA.  The following image shows the three major sectors, west, south, and east, which will be discussed for Europe-Eurasia:

A look at the Europe-Eurasia region

Like the Asia-Pacific region, the Europe-Eurasia region has many interesting features that require both temperature and precipitation to be examined.  There are island countries, such as Malta, countries that are primarily desert, such as Israel, and countries that are highly mountainous, such as Austria.  While these geographic conditions were also found in the Asia-Pacific region, what makes Europe-Eurasia different is the latitude in which these countries are found.  For the majority of the region, these countries are considered to reside in the mid-latitudes, which see a wide variety of weather.

Let’s begin by examining temperature.

Temperature

The west sector includes the GLOBE countries of: Austria, Belgium, Croatia, Czech Republic, Denmark, Finland, France, Germany, Hungary, Iceland, Ireland, Liechtenstein, Luxembourg, the Netherlands, Norway, Poland, Serbia & Montenegro, Sweden, Switzerland, and the United Kingdom.

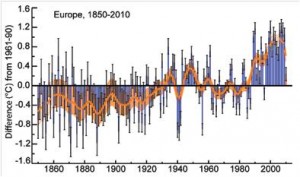
For this sector, NOAA put together a great image that shows the way temperature has been changing since 1850 (see Figure 1).  It’s a bit complex, but the main thing that should be focused on is the orange line.  The orange line is the departure of the annual temperature from an average value calculated from the base period (1961-1990).  The data displayed on the graph is for the entire sector, not specific countries.  At the end of the graph, you’ll see it’s a dashed line instead of solid.  Why dashed?  Because it all depends on what the base period is.  In this case, the base period is 1961-1990, but it’s subject to change.  You’ll notice that in the last couple of years, Europe has seen a decrease in temperatures.  Even though it’s cooler than it was in the early 2000’s, 2010 was still above normal for this sector.

1850-2010 surface temperature anomalies

Figure 1. 1850-2010 surface temperature anomalies. From 2010 NOAA State of the Climate Report

However, there were some countries that saw significantly cold years.  2010 was the coldest for Ireland since 1986, tied for the coldest for France since 1987, and was Germany’s first year colder than normal since 1997.  The end of 2010 saw temperatures between -3 and -5 degrees Celsius for Germany and France, which was the coldest December in over 40 years, while in the United Kingdom, it was the coldest December in over 100 years.

The south sector includes the GLOBE countries of: Cyprus, Greece, Israel, Italy, Macedonia, Malta, Monaco, Portugal, Spain, and Turkey.

The Iberian Peninsula, which includes the countries of Portugal and Spain, was above average for 2010, although not too much above average, at only about 1 degree Celsius.  The beginning of the year was slightly below average; however, temperatures were not nearly as cold as the west sector saw.

For the Mediterranean countries, temperatures were also warmer than normal.  Turkey and Israel experienced the warmest years since the middle of the 20th century.  An example of this warm weather, was on New Year’s Day, when Greece recorded the warmest January day in 50 years.  This region was not without cold snaps, one being in Italy at the end of January.  By the end of 2010, the Mediterranean countries saw vastly different patterns – with Italy seeing temperatures anomalies of -2 degrees Celsius, while Greece, Macedonia, and Turkey saw anomalies of +4 degrees Celsius.

The east sector includes the GLOBE countries of: Bulgaria, Estonia, Kazakhstan, Kyrgyz Republic, Latvia, Moldova, Romania, Russia, and Ukraine.

Like the south sector, the east sector saw warmer than average temperatures for 2010.  The month of July was the warmest on record for Russia, even though the Urals and Western Siberia were colder than normal.

Precipitation

In the west sector, it was a tale of two areas.  In the western portion of this sector, precipitation was slightly below average; in the eastern portion of the sector, it was near or above average.  GLOBE students living in these areas may recall a few notable precipitation events in 2010.  In February, a violent cyclone hit the coast, causing widespread power outages.  Major flooding in August along the Neisse River in central Europe resulted in evacuations of more than 1400 residents of Poland and Germany.  Finally, the onset of winter saw snow in the United Kingdom, and closed airports in Belgium, France, Germany, the Netherlands, and Switzerland.

In the south sector, annual precipitation was above average for the Iberian Peninsula.  Spain saw an increase in precipitation of more than 50%, and Portugal saw its rainiest year since 2001.  This trend continued into the Mediterranean area, where precipitation exceeded 125% of normal.  One significant rain event occurred in Turkey from 13-14 October, where 123 mm of rain fell in Bursa.  An event of this magnitude is said to occur once every 200 years.

In the east sector, there were no major departures from normal.  This was not to say that the sector saw no extreme precipitation events.  There were a few flooding events across the sector in the months of March and May due to snow-melt.  In December, a freezing rain event halted operations at airports in Moscow.

With such Europe-Eurasia being such a large region, it is no surprise that there are major climatic differences.  There is much more detail in the actual report summary: http://www1.ncdc.noaa.gov/pub/data/cmb/bams-sotc/climate-assessment-2010-lo-rez.pdf.

Does your record of GLOBE data for the past year show any similarities to the summary provided here? Have you had any significant events have you in your local area? Please share them with us through the comment option below!

Next week, we’ll continue on this journey through the GLOBE regions with a look at Latin America – Caribbean.


Posted in Climate, Climate Change, Earth System Science, General Science | Leave a comment

NOAA – State of the Climate: A look at Asia-Pacific

This week we’ll continue our look at the climate summaries for each GLOBE region, with a focus on the Asia-Pacific region.  Recall that these annual reports provide a summary of the global climatic conditions and are a great benchmark for monitoring climate.

Regional reports provide a tremendous amount of information. The temperature and precipitation climate summaries are highlighted here, but if you are interested, more information about the Asia-Pacific Region state of the climate is available from this website: http://www1.ncdc.noaa.gov/pub/data/cmb/bams-sotc/2010/bams-sotc-2010-chapter7-regional-climates-lo-rez.pdf

Unlike the Africa region, Asia-Pacific requires a breakdown of the region to explain temperature, as well as precipitation for 2010.  The GLOBE Asia-Pacific region is the combination of two NOAA climate regions: Asia and Oceania.  However, within these two regions that NOAA describes, it was easy to examine the GLOBE Asia-Pacific region.

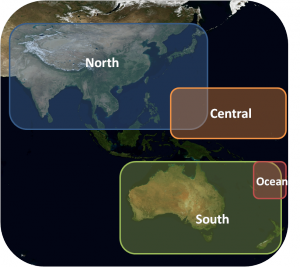
While we explained in last week’s post why temperature across Africa is much easier to describe than precipitation, with the wide variety of locations in the Asia-Pacific region, it is important to take a look at each separately.  The Asia-Pacific region takes into account land-locked countries, such as Mongolia, as well as island countries, like New Zealand.  So in order to better describe the Asia-Pacific region, it is broken down into four sectors: north, central, south, and ocean, as shown in the figure below:

Image of the GLOBE Asia-Pacific region

Temperature

The north sector includes the GLOBE countries of: Bangladesh, India, Japan, South Korea, Maldives, Mongolia, Nepal, Philippines, Sri Lanka, and Thailand.

Most of this sector saw above average temperatures for 2010, with the exception of South Korea.  For Japan, 2010 was the fourth warmest since 1989, with temperatures averaging approximately 0.86 degrees Celsius above average.  In India, 2010 was the warmest on record since records began in 1901.  Even with the warmest year being set, northern India saw a devastating cold snap during January and February.  However, by May, India was seeing heat waves.

The central sector includes the GLOBE countries of: Micronesia, Palau, and Marshall Islands.

Temperatures in this sector were variable, due to the change from El Niño to La Niña.  This means that during the first half of the year, temperatures were above normal, while in the second half of the year, temperatures were near normal or slightly below.

The ocean sector includes the GLOBE country of: Fiji.

Temperatures in Fiji were different from the other sectors in the Asia-Pacific region, because they were below average for 2010.  Fiji saw an average 0.5 degrees Celsius below normal for the year.

The south sector includes the GLOBE countries of: Australia and New Zealand.

In Australia, 2010 was the coolest year since 2001, but was still warmer than the 1961-1990 average by 0.19 degrees Celsius.  In New Zealand, annual temperatures ranged from 0.5 to 1.2 degrees Celsius above average.  More specifically, 2010 was the fifth warmest year since 1900, based on a series of seven stations.  A number of heat waves were recorded in New Zealand during 2010 in March, November, and December.

Precipitation

In the north sector, most locations saw above average rainfall.  The major exception to this was central and northeastern India and Bangladesh.  Sri Lanka saw a reverse in their precipitation patterns, as they started out dry for the first half of the year, then saw above average precipitation in the second half of the year.

In the central sector, again the change from El Niño to La Niña caused shifts in patterns, and precipitation was below normal for the first half of the year, and above normal for the second half.  On a positive note, this transition season caused tropical cyclone activity to be at an all time low.

In the ocean sector, the change from El Niño to La Niña was also apparent.  Like the central sector, precipitation was below normal for the first half of the year, and above normal for the second half.  Tropical cyclone activity was more prominent during early 2010, while only one formed during the end of the year.

In the south sector, Australia saw above average precipitation, so much so that 2010 was the second wettest year on record since 1900.  Two major flooding events were recorded during 2010, the first in late February into early March, then again in September.  New Zealand generally saw near normal rainfall amounts.

With a region as diverse as the Asia-Pacific region, it is no surprise that the region saw dramatic climatic differences.  There is much more detail in the actual report summary: http://www1.ncdc.noaa.gov/pub/data/cmb/bams-sotc/climate-assessment-2010-lo-rez.pdf.

How does your record of GLOBE data for the past year compare to the summary provided here? Were the data similar or different to the NOAA climate summary? What kind of significant events have you had in your local area? Share them with us through the comment option below!

Check back next week when we will take a look at 2010 for the Europe-Eurasia Region.

-jm

Posted in Climate, Climate Change, Earth System Science, General Science | Leave a comment

NOAA – State of the Climate: A look at Africa

In a recent blog post, we shared with you the NOAA State of the Climate report for 2010. These annual reports provide a summary of the global climatic conditions and are a great benchmark for monitoring climate. Along with the global summary, the report summarizes regions. The regions very closely overlap with the GLOBE Regions! We will go through the report and provide a summary for each GLOBE Region. A review of the Regional summaries is a great way for you to see how the climate of your region compared with the regions of other GLOBE Schools. We will start off with Africa.

All the Regional reports provide a tremendous amount of information. The temperature and precipitation climate summaries are highlighted here, but if you were interested you could get more information about the Africa Region state of the climate from this website:http://www1.ncdc.noaa.gov/pub/data/cmb/bams-sotc/2010/bams-sotc-2010-chapter7-regional-climates-lo-rez.pdf

Temperature

Temperatures for 2010 for the entire region were above normal for the entire year.  Each sector, which is broken down below, saw different magnitudes of this warmth but each saw differences of at least +0.8 degrees C above normal.  For southern Africa, 2010 was the second warmest year since 1961.

Precipitation

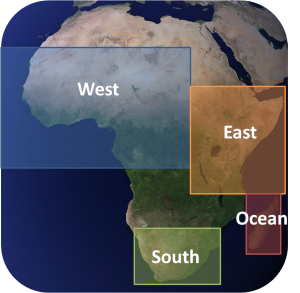
Precipitation for 2010 isn’t nearly as easy to describe in general terms, as various locations in the African Region saw dramatic differences.  Precipitation is much more difficult to summarize than temperature because it relies on many different factors, such as the migration of weather systems across an area.  Even locations in the same country can receive vastly different precipitation.  So in order to better describe the precipitation across Africa, the continent is broken down into four sectors: west, east, south, and ocean, as shown in the figure below:

Map showing Africa and its sectors

The west sector includes the GLOBE countries of: Benin, Burkina Faso, Cameroon, Cape Verde, Chad, The Republic of Congo, Gabon, Gambia, Ghana, Guinea, Mali, Niger, Nigeria, and Senegal.

In the northern portion of this region, the Sahel experienced rainfall amounts that made 2010’s rainy season the wettest since 1958.  In the southern portion of the region, rainfall was significantly less than normal.  The significant rain fall that fell in during the rainy season in the Sahel caused widespread flooding in many places, including the GLOBE countries of Senegal and Guinea.

The east sector includes the GLOBE countries of: Ethiopia, Kenya, Rwanda, Tanzania, and Uganda.

For the first half of 2010, the northern portion of the east sector saw above average rainfall, including Ethiopia, Kenya, Rwanda, and northern Uganda.  In Tanzania, however, rainfall amounts were less than normal, where rainfall amounts were only approximately 25-75% of normal values.   The second half of 2010 saw a change in rainfall, where amounts dropped to be below or near average.  Regions of Kenya saw less than 25% of their normal rainfall from September through December.  The below average rainfall during the months of September through December resulted in widespread stress on climate-dependent industries.  These include crop failure, water limitations for both industrial and domestic use, water contamination, and malnutrition.

The south sector includes the GLOBE countries of: Namibia and South Africa.

In general, the rainy season in this region did not see major departures from normal.  However, South Africa saw many extreme events.  January started out with heavy rain and flooding in the northeast portion of the country, and by June, snow was reported in areas for the first time in 18 years in central South Africa.  Extreme events were also noted, with severe hailstorms, lightning-ignited wild fires, and tornadoes.

The final sector of interest is the ocean, which includes the GLOBE country Madagascar.

The majority of Madagascar saw below average rainfall for 2010, with the exception of the southeast coast and a line running east-west through Antsakabary.  These extreme deficits in rainfall caused the government to impose strict water supply restrictions due to the dam being at only 50% capacity.

As you can see the climate variability is very significant across the continent! There is much more detail in the actual report summary: http://www1.ncdc.noaa.gov/pub/data/cmb/bams-sotc/climate-assessment-2010-lo-rez.pdf.  You can see how critical it is to understand climate from the notable events summarized for each area.

How does your record of GLOBE data for the past year compare to the summary provided here? Were the data similar or different to the NOAA climate summary? What kind of significant events have you had in your local area? Share them with us through the comment option below!

Check back next week when we will take a look at 2010 for the Asia-Pacific Region.

-jm

Posted in Climate, Climate Change, Earth System Science, General Science | Leave a comment