Reading the Sky

by Dr. Lin Chambers

Recently I attended a band concert at my daughter’s middle school. As we were leaving the concert at about 8 pm, I glanced up at the sky and saw a curious sight. What an odd-looking contrail, I thought. A fellow parent, also a NASA employee, was better informed. That’s the trail from a rocket launch at NASA’s Wallops Flight Facility, he said. Of course, I thought, as soon as he said it. That explains the odd features of this “contrail”. A contrail, as readers of this blog know very well, is a condensation trail (a cloud) left in the sky after the passage of an aircraft (or, in this case, a spacecraft!).

Rocket launch as viewed from Hampton, VA. Photo courtesy Allen Kilgore, NASA Langley Research Center

Rocket launch as viewed from Hampton, VA. Photo courtesy Allen Kilgore, NASA Langley Research Center

There is a lot to be learned from looking at the sky, but it can be hard to read correctly because our perspective on Earth’s surface combines with the curvature of the Earth to produce some confusing optical effects. In this case, the perspective I had from a point about 115 km (~70 mi) southwest of the launch point (Fig. 2) made the trail appear at first like a regular contrail crossing the sky horizontally. But as I continued to watch, it became clear that this was no ordinary contrail. Rather than continuing across the sky, the trail clearly became higher and higher until it vanished entirely as the rocket left the bulk of the atmosphere behind.

Google Earth Map showing the location of the launch site (Wallops Island, VA), and my approximate location when I saw the trail, 115 km (~70 mi) to the southwest.

Google Earth Map showing the location of the launch site (Wallops Island, VA), and my approximate location when I saw the trail, 115 km (~70 mi) to the southwest.

Aside from that high arc, this trail had some other odd features, even in the early part that looked at first glance like a horizontal contrail. Unlike a typical contrail, which is usually pretty smooth, this trail looked quite narrow and unusually wiggly, until at one point it smoothed out and became even and much fainter. Those wiggles in the early part of the contrail, I discovered, were from adjustments in the pointing of the rocket as it zoomed through the atmosphere. This is apparent in the video of the launch. (Click here to view)

The winds were relatively light that evening, so about 45 minutes later when we left a local ice cream shop after the post-concert celebration, the trail was still clearly visible overhead. However, having had time to drift some with the winds, the trail now looked like a contrail left behind by a crazed aerobatic pilot who was doing a series of loops. From my point of view, there was nothing to tell me that those loops weren’t a horizontal set of circles from a plane flying at a constant altitude. But, knowing that a rocket had left the trail, I could correctly interpret them as looking up a spiral of a trail laid out at higher and higher levels of the atmosphere.

I so wished that we had not just filled our camera’s digital memory card with the sights and sounds of a middle school concert band – no matter how good they were; and how proud we parents! Later I searched the web and found the picture below, from a Shuttle launch, which gives you some idea of what we saw.

The trail left behind after a Shuttle launch.

The trail left behind after a Shuttle launch.

While this experience is an extreme example of perspective problems in the atmosphere, the same influences are at work whenever we humans look up at the sky. I encourage you to take opportunities to look up, and see if you can read the sky while correctly taking into account your ground-based perspective.

Posted in General Science | 2 Comments

Understanding the Copenhagen Climate Summit

By Dr. Charles Kironji Gatebe, NASA Scientist for GLOBE Student Research Campaign on Climate

In the coming weeks and months, you will hear a lot from the media about the Copenhagen Summit that will be held in Denmark from  6-18 December 2009. The goal of the summit is to Picture 1negotiate an international treaty to prevent global warming and climate change. The summit is expected to attract over 8,000 participants including Governmental representatives from different countries, non-governmental organizations, and journalists from all over the world. The climax will be a High-Level, 3-4 day period, when many Heads of States and Governments or their representatives will attend the summit and announce their commitments on behalf of their states or governments.  As a student, how does this summit affect you?

This summit reminds me of the days when I used to represent my country at the United Nations meetings back in the early 90s, when Agenda 21 was a very popular word. Agenda 21 is a comprehensive plan of action for the 21st Century, hence the name, to be taken globally, nationally and locally by organizations of the United Nations System Governments, and major groups in every area in which humans impact the environment. It was adopted at the United Nations Conference on Environment and Development (UNCED), the Earth Summit, held in Rio de Janeiro, Brazil, in June 1992 by more than 178 Governments. Agenda 21 created among other things a new global partnership between various groups such as governments, business people, trade unions, scientists, teachers, indigenous people, women, youth and children in combating degradation of the land, air and water, and conserving forests and the diversity of species of life.  It was a truly new global partnership for sustainable development!

The UNCED conference also adopted the United Nations Framework Convention on Climate Change (UNFCCC) treaty that started to consider what could be done to reduce global warming and to cope with the temperature increases that are inevitable. The Convention now enjoys near-universal acceptance by 193 countries or Parties. The ultimate objective of the Convention is to stabilize greenhouse gas concentrations in the atmosphere at a level that will prevent dangerous human interference with the climate system. The Convention was amended in 1997 to include mandatory targets requirements for controlling greenhouse gas emissions. The Protocol has so far gained support of 184 Parties, so is not as popular as the original UNFCCC, which only encourages countries to reduce greenhouse gas emissions with no specific targets as set out in the Kyoto Protocol. Note that the name Kyoto derives from the city where the protocol was adopted. The Kyoto Protocol is generally seen as an important first step towards a truly global emission reduction regime that will stabilize greenhouse gas emissions, and provides the essential architecture for any future international agreement on climate change. The Kyoto Protocol will cease to apply after 2012, and so the Copenhagen Summit and others that will follow are working hard to add new life to it, or come up with a successor.

Finding an answer to the melting of snow and ice in such places as Greenland is one of the main hopes for the summit. Picture taken in Ellesmere Island, Canada (78.52°N, 76.43°W; 93 km west of Greenland) 8 April 2008 during a research flight on NASA P-3B aircraft by Charles Gatebe.

Finding an answer to the melting of snow and ice in such places as Greenland is one of the main hopes for the summit. Picture taken in Ellesmere Island, Canada (78.52°N, 76.43°W; 93 km west of Greenland) 8 April 2008 during a research flight on NASA P-3B aircraft by Charles Gatebe.

Note that since 1995, there is an annual Kyoto-like summit, officially known as the Conference of Parties to the UNFCCC. This year’s summit in Copenhagen is the 15th Conference of Parties and is therefore being dubbed simply as COP-15. The Kyoto Summit was COP-3. The main purpose of these conferences is to assess the progress made in dealing with climate change and discuss how the convention’s goals to stabilize the amount of greenhouse gases in the atmosphere at a level that prevents dangerous man-made climate changes can be implemented in practice.

The Conventions are administered by the United Nations Climate Change Secretariat, which is based in Bonn, Germany. The secretariat’s tasks include monitoring the development of the individual countries’ greenhouse gas emissions, as well as keeping watch on which countries agree to implement the Kyoto Protocol, which established legally binding obligations for developed countries to reduce their greenhouse gas emissions.

An important part of the scientific background for the political decisions made in the conferences is the work of the Intergovernmental Panel on Climate Change (IPCC). The IPCC was established to provide decision-makers and others interested in climate change with an objective source of information about climate change. IPCC has so far published four Assessment Reports (in 1990, 1995, 2001 and 2007). The IPCC was set up by the World Meteorological Organization (WMO) and by the United Nations Environment Programme (UNEP) in 1988.  In the early 1990s, I participated in the IPCC meetings, especially those that took place at UNEP Headquarters in Nairobi, Kenya.  It was very interesting to see the discussions on carbon emissions and how the emissions are inextricably linked with wider questions of the pressure on all natural resources, land and water and the process that informs the Assessment Reports.

As a student, it is so important to use this opportunity to increase your awareness of climate changes and how man-made activities such as burning of fossil fuels and coal for our energy needs, cutting of trees, etc. contribute to increased greenhouse gases (the six main gasses mentioned in the Convention are Carbon dioxide (CO2), Methane (CH4), Nitrous oxide (N2O), Hydrofluorocarbons (HFCs), Perfluorocarbons (PFCs), and Sulphur hexafluoride (SF6)) that cause temperatures to rise. The Earth’s average temperature has risen by 0.74 degrees centigrade (1.33 degrees Fahrenheit) in the period from 1906 to 2005 according to the most recent assessment report from the IPCC and will continue to rise.

Agenda 21 captures the current feeling about climate change very well: “That humanity stands at a defining moment in history. We are confronted with a perpetuation of disparities between and within nations, a worsening of poverty, hunger, ill health and illiteracy, and the continuing deterioration of the ecosystems on which we depend for our well-being. However, integration of environment and development concerns and greater attention to them will lead to the fulfillment of basic needs, improved living standards for all, better protected and managed ecosystems and a safer, more prosperous future. No nation can achieve this on its own; but together we can – in a global partnership for sustainable development.”

The choices we make today will determine the severity of impacts in the future; a future that will confront you as an adult. So stay tuned for more news from the Copenhagen Summit 2009.

Posted in General Science | Leave a comment

The Vocabulary of Science

By Dr. Lin Chambers, NASA Scientist for GLOBE Student Research Campaign on Climate

My adventures in science began relatively late, after an extensive engineering education and 10 years of professional work in aerospace engineering.  (Unless you want to count my very early experiences with science, as the daughter of an inquisitive physicist.  But maybe that is a subject for another blog.)  One of the things that struck me as I started working as a practicing scientist was the importance of vocabulary in science.  I think many people have learned, somewhere in their education, about the crucial difference between “accuracy” and “precision” in measurement – two terms that are pretty much interchangeable to most “regular” people.  (“Accuracy” is how close a measurement is to the actual value of whatever it is you’re trying to measure; “precision” is the repeatability of that measurement.)  Vocabulary of science goes far beyond that, however.

I vividly remember giving one of the first presentations of my new career as a scientist, within the first two years of my career switch.  I was talking about a study I did using computers to calculate how sunlight interacts with clouds of various shapes, and I said something about “water vapor”.  To me, as a pretty expert computer modeler but a rather new scientist, that meant “water in the air” – as in clouds.  But to my audience, that was a complete misstatement.  The term I should have used was “water droplets” – particles of liquid water in the atmosphere.  “Water vapor” of course, as most elementary students learn, is water in the gas phase, which is not what clouds are made of!  Making that mistake in front of a large audience of scientists was a very lasting way to learn the difference, and I’ve never made that mistake again.

Over the years, I’ve learned that the vocabulary of science is really crucial to advancing scientific understanding.  Words have to have meaning to represent science concepts.  As science gets more and more specialized, those meanings must become more and more exact.  This is not restricted entirely to science, of course.  Many specialty areas have their own vocabularies as well:  music, art, education, law.  The list goes on.

One of the most visible places where the vocabulary of science clashes with the vocabulary of regular people is in the use of the term “theory”.  As in “Theory of Evolution”, “Theory of Relativity”, “Theory of Gravitation”, etc.  To a regular person, a theory is just an idea that someone has cooked up – it might even be a pretty crazy idea.  To a scientist, a theory is a proposed explanation that fits a set of observations.  For theories that have been around a long time, like gravity, most of the theory is pretty well understood and pretty solid.  (But don’t ask me to explain how gravity actually does its thing.  I just know that I don’t need to worry about falling off the world.)

Another place where vocabulary has caused some misunderstandings is with climate change.  Originally, the term that was in common usage for this idea was “global warming”.  However, this term is not very descriptive of the observed or predicted situation and many scientists have stopped using it.  The term leads to misconceptions, as has been discussed on this blog previously by Dr. Peggy LeMone in Climate Change Misconceptions and More Climate Change Misconceptions Part 1 and Part 2.  But before we can discuss “climate change” we need to make sure we have the same meaning for the term “climate”.  While the definition is typically something that students learn in elementary school, and can repeat when asked, that doesn’t always mean that they have “got” it – like me with my “water vapor” clouds.

So what is climate, really?  Climate is the weather conditions in a particular place in the world over long time periods.  Those conditions are described by the same things that describe the weather – temperature, pressure, humidity, rainfall, etc. – so they are very closely connected.  But they are not the same!  This is a weird and unintuitive idea, and doesn’t fit well with the day-to-day life and experiences of the average human being.  It’s very common to hear someone make a comment like “Boy it’s hot today!  Climate change must be really kicking in.” or “What Arctic weather!  I guess we don’t have to worry about climate change”.  But this type of comment is mixing apples and oranges.  Let’s think about this for a moment.  Scientists usually define the climate for a given place by using data for 30 years at least; more if they can get it (remember that “over long time periods” in the definition).  So a really cold or warm day (weather) represents at most 1 out of (365 days * 30 years) of information that goes into defining climate.  That’s less than 0.1 percent of the information needed to define the climate – pretty small!

To explore what this means, I went to the US Historical Climatology Network and got the official temperature records for the closest available station to where I live.  Pulling out a 30-year stretch of data beginning in 1974, I get this plot.

Figure 1.  Daily average temperature over a 30-year period from an official measurement station at Hopewell, Virginia.

Figure 1. Daily average temperature over a 30-year period from an official measurement station at Hopewell, Virginia.

The extreme low temperature in this 30-year period is -23.9 °C (-11 °F).  The extreme high temperature is 40.6 °C (105 °F).  (The high and low are instantaneous temperatures; not daily averages.)  The average temperature for the 30-year period is 16.04 °C (60.88 °F).  Let’s say that today it is very cold – as cold as the coldest day in 30 years.  If we average that in with the 30-year record we get an average, climatological temperature of 60.87 °F. (Sometimes this is also referred to as the “normal” temperature.) One extreme day changes the normal temperature for the region by less than 0.01 °F – an unmeasurable amount!  Let’s say today is instead extremely hot – as hot as the hottest day in 30 years.  The new normal temperature is now 60.885 °F – an even smaller change!  Bottom line:  one day of unusual weather doesn’t change the climate at all.

A little experimentation with this data set shows that it would take at least two and a half weeks of weather at the extreme low or high temperature to change the climatological or normal temperature by 0.1 °F.  And that change is still not measurable except by the most precise of thermometers.  What can we learn from this experiment?  Day-to-day human experience is not a good indicator of climate or climate change.  It takes careful measurements over a long time period (and over large regions as well, but that’s another topic) in order to define and measure climate and climate change.

See if you can identify some vocabulary words in your local newspaper, radio or TV station that are used differently than they are used in your science class.

Posted in General Science | Leave a comment

On a Research Expedition to Mount Kenya: Africa’s Second Highest Mountain – Part 3

By Dr. Charles Kironji Gatebe, NASA Scientist for GLOBE Student Research Campaign on Climate

The next morning, we arrive at the sampling site and proceed to extract the filters on which atmospheric particle (or aerosol) samples have been collected by the Streaker sampler shown in Figure 5, and to replace them with new filters. This filter exchange operation has to be performed with great care, as any mistakes, however small, can be costly and could lead to loss of data collected over a whole month’s period, or cause damage to the new filters we are about to load. This can be a difficult thing to do, given that we are working outside, sometimes in extreme weather conditions such as blizzards with strong winds in excess of 15 m/s, accompanied by snow and severe cold, coupled with the fact that our bodies still feel fatigued from the previous day’s steep climb and long walk. Nevertheless, we have to manage all these challenges with focused determination to accomplish our mission, which is one of the characteristics of a good scientist.

Our sampling station consists of a Streaker sampler (manufactured by PIXE International Corporation, Tallahassee, Florida, USA), a pump system, a battery, and a solar panel. The Streaker operates from a 12-volt battery with low power consumption, which allows us to run the instrument in the field for an extended period of time without access to electricity. The station is painted green to try to match the surrounding environment and, hence, reduce visual impacts to wildlife. The Streaker is a time-sequenced air-particulate sampler designed to sample particles in the air in two size groups: (i) fine – particles of size 2.5 microns and less, which is about 100 times thinner than a human hair, and (ii) coarse – particles of size 2.5–10 microns. With a flow rate of one liter per minute, air enters the inlet non-moving impaction stage (marked “A” in Figure 5b) onto a rotating impaction stage (“B”) and exits via a rotating filter stage (“C”), which retains most of the smaller particles. Note that stage “A” removes particles from the airstream larger than 10 microns and allows coarse and fine particles to pass through, and stage “B” collects coarse particles and allows fine particles to pass through to stage “C”, where they are deposited. Figures 6a and 6b show the two filters used with the Streaker. The Mylar filter (Fig. 6a; see also Fig. 5: stage filter “A”) looks like a plastic food wrap, but less sticky, and Fig. 6b, (see also Fig 5: stage “B”) is a Nuclepore filter with pore sizes of about 0.4 microns. If you would hold up these two particle filters to a light bulb, you would more easily see light through the Mylar than through the Nuclepore filter.

fig5_gateby.jpg

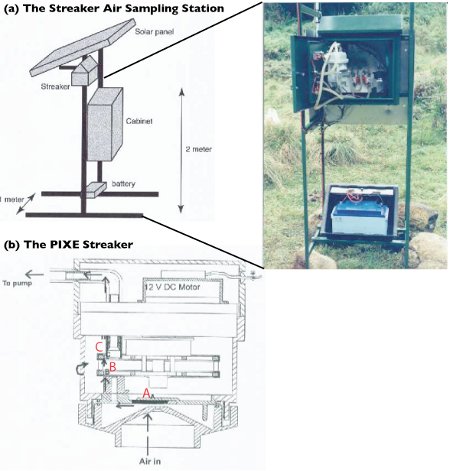
Figure 5a: Sampling Station, which consists of a Streaker sampler, a pump system, a solar panel, and 12-volts battery. Shown in the picture is a real pump system that is housed in a green-coated metal cabinet, while the battery is housed in a plastic case to protect it from extreme cold weather conditions. The height of the Streaker sampler is about 2 m above the ground. In Fig. 5b, as air enters and exits the Streaker sampler, particles in the airstream are deposited on either stage A, B or C. Larger particles are removed from the airstream at A, medium particles at B, and smaller particles at C.

fig6_gateby.jpg

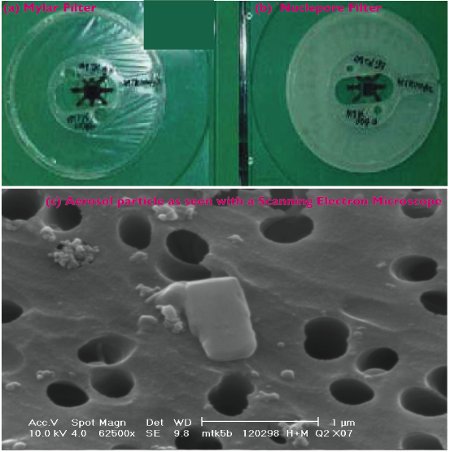
Figure 6: Special filters (a and b) that are used for particulate sampling, while (c) shows aerosols particles collected on a Nucleopore filter, magnified tens of thousands of times by an electron microscope.

fig71_gateby.jpg

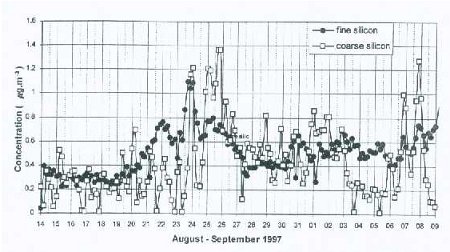
Figure 7a: Time series of 4-hourly concentrations of silicon obtained from the analysis of coarse and fine filters.

The two particle filters can be analyzed in a laboratory to determine chemical composition of the collected aerosol samples, using ion-beam methods such as X-rays, as shown in the Fig. 6c example. This allows a direct link to be established between particulate pollution measured at the mountain site with long-range transport of particles at high altitudes in the atmosphere. If we were to look at a time series of the concentrations of different chemical elements plotted on the same graph from measurements taken several times a day (our data has a time interval of about 4 hours over a period of 28 days), we can see changes (increase or decrease) in the concentrations of these elements, following changes in the local daily wind. However, when a moving time averaging of 36 hours is performed, it removes diurnal changes caused by upslope–downslope winds, and reveals variations associated with wind patterns caused by large scale weather systems, such as pressure differences over large areas, or storm systems such as hurricanes or cyclones. From past studies, it has been found that local circulation systems affect aerosol concentration several times a day as demonstrated in Figure 7a, while longer time-scale variations superimposed on the diurnal variations can be observed in the smoothed time series curves, as shown in Figure 7b. It is generally assumed that fine particles are transported over longer distances than coarse particles, although there is evidence that dust from the Sahara desert, containing a large fraction of coarse-size particles, is transported across the Atlantic Ocean to the USA, the Carribean, and parts of South America within a few days. This assumption makes it easier to differentiate between changes in particulate chemical concentration associated with local sources and those associated with distant sources, and transported to the site by the free tropopheric air. This type of experiment is possible on a high mountain such as Mt. Kenya, which allows sampling in the free troposphere, especially at night when the winds are predominantly blowing downslope and far removed from major pollution sources, and therefore represent pollution from distant places.

fig7b_gateby.jpg

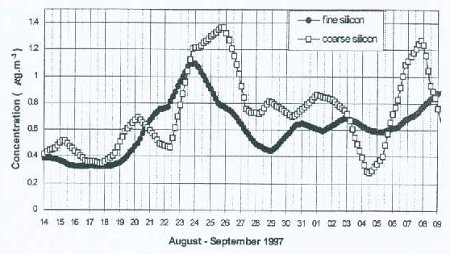
Figure 7b: 36-hour moving average of the 4 hourly data shown in Figure 7a.

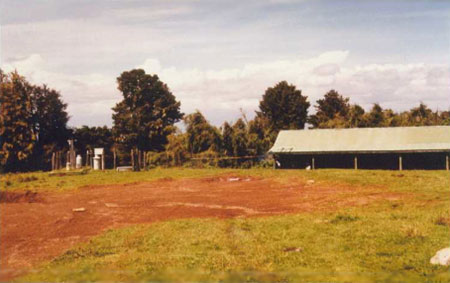
After we change the samples, we decide to go down the mountain using a trail that takes us through the northern side of the mountain and through a permanent monitoring site, shown in Figure 8, run by the Kenya Meteorological Department under the World Meteorological Organization (WMO), Global Atmospheric Watch Program (GAW). This station monitors greenhouse gases such as carbon dioxide and methane, and basic meteorological parameters such as pressure, humidity, temperature, wind speed, wind direction, and radiation on a continuous basis. For more information on the GAW station visit their web site at: gaw.empa.ch/gawsis/reports.asp. The WMO data collection site, like many others located elsewhere in the world, provides valuable data that students from all over the world can download for free and use in climate related research. Try examining some of the data yourself. Look for changes in chemical concentrations with time, and see if you can establish any correlation with weather parameters such as wind speed and direction, humidity, radiation, etc., or try to identify sources of pollution in your area such as industries or factories, motor vehicles, and fires.

fig8_gateby.jpg

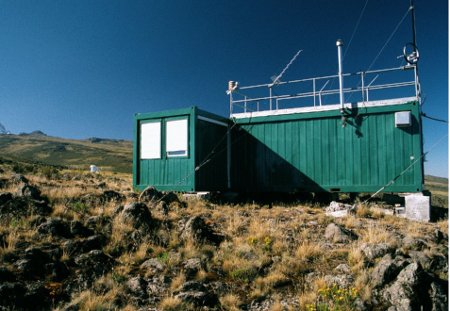
Figure 8: Mt Kenya GAW Station established in 1999. Picture from http://gaw.empa.ch/gawsis/reports.asp?StationID=57.

The trek down the mountain is much easier, especially if your knees are strong, and it takes much less time to get to the base station. I will let you enjoy the rest of the walk from the GAW site to the base station, and hope that this blog inspires many of you to think of a climate related research and to participate in the GLOBE’s Student Climate Research Campaign. In future, we will discuss NASA satellites that can be used for monitoring air pollution.

Posted in General Science | Leave a comment

On a Research Expedition to Mount Kenya: Africa’s Second Highest Mountain – Part 2

By Dr. Charles Kironji Gatebe, NASA Scientist for GLOBE Student Research Campaign on Climate

We begin our journey up Mount Kenya at Met Station (shown in Figure 3, altitude 3050 m AMSL) early in the morning around 6 a.m., while the dew is still resting on the grass. The sun has not yet risen, but there is enough light to see our way through the bushes and to keep us safe from wild animals such as elephants, buffaloes, and leopards which dwell in this area, which is a protected national park. The animals usually retreat deeper into the forest during daytime, and like to stay away from the walking trails. However, we need to stay alert and beware of the wild animals wandering around in search of food, as they can be a danger to life. As we head out, the birds are already singing. We watch for silver Mountain Greenbul, Stulmans Sterling, various species of flycatchers — about eight in this area, Verreaux Eagles and many more.

fig_3_mt-kenya.jpg

Fig. 3: The Met Station on the southwestern slopes of the mountain. Most mountaineers prefer to spend a night here to help acclimatize to thinner air at 3050 m above mean sea level. The house in the background is used Kenya National Park Rangers, who help coordinate rescue operations. To the left of the house is a small meteorological station. Try to identify a rain gauge, a Stevenson’s screen and a wind vane in the picture. Note also the red volcanic soils. I took this picture in 1997 during a research expedition.

Our trail takes us through the forested zone and leads to an almost treeless zone (the moorland), which is dominated by swampy wet soils with amazing plants (many varieties of lobelias, tussocks, red hot pokers and giant senecio trees) and a varied topography. It is extremely difficult to walk in this zone, especially during a rainy season because of slippery ground. As we enter the moorland zone, we discover that we are above the treeline (>3300 m). From the Met Station to this point, it takes anywhere between 1-2 hours, so by now we are feeling tired and struggling to catch our breath. Throughout the climb we should try to maintain a slow pace and take fluids constantly to help reduce chances of catching what is known as Acute Mountain Sickness (AMS), whose primary symptom is a headache (usually occurring at an altitude above 2500 m) combined with conditions such shortness of breath, nausea or vomiting, or tiredness. Note that a headache can also be a symptom of dehydration. Also, beware of sunburn at a higher altitude as thinner atmosphere provides less protection from the sun’s ultraviolet radiation. It is advisable to apply sunscreen with at least 30 sun protection factor (SPF).

Since we are now above the treeline, we have an unobstructed view of the sky. I should point out that mountains provide a natural and permanent vantage point for observing the upper atmosphere and were used in the past as observing platforms for meteorological observations in the upper air, long before kites and ballons came into being. Nowadays, radiosondes and satellites are routinely used for observing the atmosphere from privileged vantage points in the atmosphere and space, respectively.

Also, here above treeline, we can take a break and look back down on our hiking trail. On a clear day we can see a beautiful country in every direction from south towards the City of Nairobi and to the North towards Nanyuki Town. The landscape stretches westwards towards the Aberdare Mountains, which form part of the eastern arm of the Great Rift Valley. The altitude variation gives rise to a fairly well defined vegetation belts as shown in Figures 2 (see Part 1), which are associated with different temperatures and rainfall regimes. The agricultural zone extends up to 2800 m in some places on the mountain. The forest zone follows between about 2000 and 3300 m and contains areas of indigenous forest plantations, merging into the bamboo and Rosewood zones with increasing altitude. Looking towards the mountain peak, the moorland zone is found between 3300 and 4000 m and merges into the afro-alpine zone from 4000 4500 m. The so called nival zone (zone of rock and ice) follows, extending up to the top of the summit peaks. The photographs in Figure 2, are arranged from the lowest to highest mountain elevation to highlight the different zones a result of the changing altitude. Students can fly several kites extending to different heights in the atmosphere carrying simple meteorological sensors, such as a thermometer and an anemometer to measure weather parameters and observe changes associated with altitude.

From studies done in the past, rainfall maximums occur on the southeastern side of the mountain (geographers like to call it the windward side) with an annual rainfall > 2500 mm; while the northern side (the leeward side) experiences less rainfall: 800 – 1200 mm. Rainfall amounts also decrease fairly smoothly toward the summit and towards the lowlands. Temperature varies considerably with altitude and diurnal range is considerable. The variation causes wind to blow down the mountain during the night and early morning, and up the mountain from mid-morning to evening. There are more sunshine hours in the northern part than in the south and southeastern parts, which are obviously more cloudy.

Next, we continue our long trek uphill on Teleki Valley and arrive at Mackinders Camp at 4200 m. Note that from the Met Station to Mackinders Camp, it is a distant of about 10 km and an ascent of 1935 m. It is quite a long stretch to walk and can take anywhere between 5 and 15 hours, depending on prevailing weather conditions. Wet weather is not good for climbing this mountain. This is not our destination, but it offers a good place to rest and enjoy views of the magical twin peaks of Mt Kenya (see Part 1, Figure 2f). Batian Peak is on the left and Nelion on the right and there is a small glacier at the base, where the snow comes down the Couloir (not visible in the picture). This is more than a camp; it is a large stone hut with multiple bunk rooms and set up to cater to a large trekking groups that come through here. Small mammals known as the mountain hyrax abound in this area and can be seen lying happily on the rocks enjoying the sunshine and others scuttering around (see Figure 4).

Our station is a little further towards the summit at 4220 m, about 30 minutes from Mackinders camp. We will spend a night at Mackinders and continue to the sampling station in Part 3.

fig_4_mt-kenya.jpg

Fig.4. This is me in the picture with the small mammals, the rock hyrax. These mammals are rat-like in appearance, but with a stumpy tail, and about the size of a domestic cat. Despite their size and appearance, their closest living relative in the animal kingdom is the Elephant. Although not visible, hyraxes have surprisingly large tusks.

Posted in General Science | 3 Comments